HTC 2010 Annual Report Download - page 54
Download and view the complete annual report
Please find page 54 of the 2010 HTC annual report below. You can navigate through the pages in the report by either clicking on the pages listed below, or by using the keyword search tool below to find specific information within the annual report.-
 1
1 -
2
-
3
-
4
-
5
-
6
-
7
-
8
-
9
-
10
-
11
-
12
-
13
-
14
-
15
-
16
-
17
-
18
-
19
-
20
-
21
-
22
-
23
-
24
-
25
-
26
-
27
-
28
-
29
-
30
-
31
-
32
-
33
-
34
-
35
-
36
-
37
-
38
-
39
-
40
-
41
-
42
-
43
-
 44
44 -
 45
45 -
 46
46 -
 47
47 -
 48
48 -
 49
49 -
 50
50 -
 51
51 -
 52
52 -
 53
53 -
 54
54 -
 55
55 -
 56
56 -
 57
57 -
 58
58 -
 59
59 -
 60
60 -
 61
61 -
 62
62 -
 63
63 -
 64
64 -
65
-
66
-
67
-
68
-
69
-
70
-
71
-
72
-
73
-
74
-
75
-
76
-
77
-
78
-
79
-
80
-
81
-
82
-
83
-
84
-
85
-
86
-
87
-
88
-
89
-
90
-
91
-
92
-
93
-
94
-
95
-
96
-
97
-
98
-
99
-
100
-
101
 |
 |

106 2 0 1 0 H T C A N N U A L R E P O R T 107
FINANCIAL INFORMATION
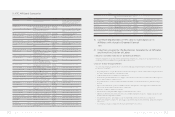
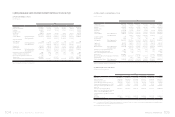
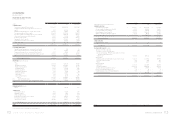
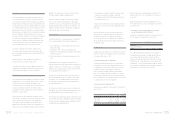
(4) Abbreviated Consolidated Income Statements
Unit: NT$ thousands (Except EPS NT$)
Year
Item 2010 2009 2008 2007(Note 2) 2006(Note 2) 2011 1Q
Revenues 278,761,244 144,492,518 152,353,176 118,217,545 105,358,397 104,156,600
Gross Profit (Note 1) 83,868,739 46,162,981 50,990,638 44,164,632 32,516,182 30,470,410
Operating Income (Note 1) 44,132,581 24,622,907 30,345,270 30,660,255 25,745,994 16,470,484
Non-operating Income and Gains (Note 1) 1,142,944 1,420,086 2,319,489 1,771,846 1,284,052 734,476
Non-operating Expenses and Losses (Note 1) 311,137 646,581 929,043 200,165 87,329 155,806
Income from Continuing Operations before
Income Tax
44,964,388 25,396,412 31,735,716 32,231,936 26,942,717 17,049,154
Income from Continuing Operations 39,514,844 22,614,413 28,552,526 28,917,712 25,234,342 14,832,864
Income (Loss) from Discontinued Operations - - - - - -
Income (Loss) from Extraordinary Items - - - - - -
Cumulative Eect of Changes in Accounting
Principle
-- - - - -
Net Income 39,514,844 22,614,413 28,552,526 28,917,712 25,234,342 14,832,864
Net Income Attributable to Shareholders of
the Parent
39,533,600 22,608,902 28,635,349 28,938,862 25,247,327 14,832,864
Basic Earnings Per Share 48.49 27.35 34.44 34.74 30.07 18.36
Note 1: In accordance with 2008 and 2010 financial reporting requirements, write-downs of inventories or reversal of write-downs and product warranty costs registered during the
period 2006 to 2007 have been reclassified as cost of revenues items.
Note 2: Excluded employee bonus expenses
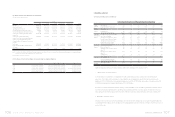
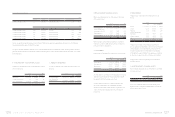
(5) The Name of the Certified Public Accountant and the Auditor's Opinion
Year CPA Firm Certified Public Accountant Auditor's Opinion
2006 Deloitte Touche Tohmatsu Tze-Chun Wang and Kwan-Chung Lai Unqualified Opinion
2007 Deloitte Touche Tohmatsu Ming-Hsien Yang and Kwan-Chung Lai Unqualified Opinion
2008 Deloitte Touche Tohmatsu Ming-Hsien Yang and Kwan-Chung Lai Modified Unqualified Opinion
2009 Deloitte Touche Tohmatsu Ming-Hsien Yang and Tze-Chun Wang Unqualified Opinion
2010 Deloitte Touche Tohmatsu Ming-Hsien Yang and Tze-Chun Wang Unqualified Opinion
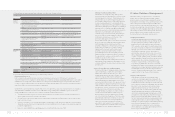
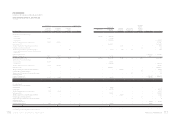
2. FINANCIAL ANALYSIS
(1) Financial Analysis (Unconsolidated)
Year
Item (Note 2~3) 2010 2009 2008 2007(Note 1) 2006(Note 1) As of 2011.3.31
Capital
Structure
Analysis
Debt Ratio (%) 59 45 47 38 35 59
Long-term Fund to Fixed Assets
Ratio (%)
683 790 822 1,509 1,463 799
Liquidity
Analysis
Current Ratio (%) 144 188 186 242 264 144
Quick Ratio (%) 120 171 169 218 233 119
Times Interest Earned (Times) 967,203 192,463 136,167 133,409 90,464 -
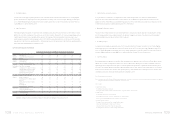
Operating
Performance
Analysis
Average Collection Turnover (Times) 5.92 4.92 6.09 6.01 6.09 6.35
Days Sales Outstanding 62 74 60 61 60 57
Average Inventory Turnover (Times) 11.77 11.71 12.68 12.14 13.01 10.33
Average Payment Turnover (Times) 4.59 3.72 4.08 4.03 4.80 4.7
Average Inventory Turnover Days 31 31 29 30 28 35
Fixed Assets Turnover (Times) 25.14 17.43 20.68 31.91 36.02 35.95
Total Assets Turnover (Times) 1.49 1.21 1.32 1.31 1.59 1.86
Profitability
Analysis
Return on Total Assets (%) 26 22 28 37 48 30
Return on Equity (%) 56 37 49 59 77 72
Operating Income to Paid-in Capital
Ratio (%)
517 306 401 533 592 187
Pre-tax Income to Paid-in Capital
Ratio (%)
544 320 418 561 618 204
Net Margin (%) 14 16 19 24 24 15
Basic Earnings Per Share (NT$) 48.49 27.35 34.44 34.74 30.07 18.36
Cash Flow Cash Flow Ratio (%) 37 51 69 116 106 19
Cash Flow Adequacy Ratio (%) 157 201 221 291 296 155
Cash Flow Reinvestment Ratio (%) 26 11 28 47 44 25
Leverage Operating Leverage 1.43 1.54 1.44 1.20 1.16 1.35
Financial Leverage 1.00 1.00 1.00 1.00 1.00 1.00
Significant changes in various performance indicators reflected the doubling of HTC’s business in 2010.
1. Capital Structure & Liquidity Analyses
As of year-end 2010, our debt ratio stood higher at 59% while current and quick ratios were both lower at 144% and 120%,
respectively. This situation reflected increases in current liabilities due to rapid business growth that saw notes and accounts
payable rise 131% to NT$58.4 billion, accrued marketing expense rise 84% to NT$15.7 billion, accrued bonus to employees rise 75%
to NT$8.5 billion, and product warranty liabilities grow 71% to NT$9.1 billion.
HTC carries no external loans and equity funds currently cover all expenditure needs. The relatively small interest expense entered
into the income statement primarily reflects operating leases and imputed interest on security deposits. Reductions in these two
items during 2010 saw interest expense fall for the year to NT$46,000 and times interest earned rise 403% over year-end 2009.
2. Operating Performance Analysis
Fixed asset turnover, total asset turnover, and average collection turnover were all higher due to strong revenue growth. Days sales
outstanding fell from 74 days in 2009 to 62 days in 2010. Average payment turnover increased to 4.59 due to the 97% rise in cost of
revenue for the year.