HTC 2010 Annual Report Download - page 55
Download and view the complete annual report
Please find page 55 of the 2010 HTC annual report below. You can navigate through the pages in the report by either clicking on the pages listed below, or by using the keyword search tool below to find specific information within the annual report.-
 1
1 -
2
-
3
-
4
-
5
-
6
-
7
-
8
-
9
-
10
-
11
-
12
-
13
-
14
-
15
-
16
-
17
-
18
-
19
-
20
-
21
-
22
-
23
-
24
-
25
-
26
-
27
-
28
-
29
-
30
-
31
-
32
-
33
-
34
-
35
-
36
-
37
-
38
-
39
-
40
-
41
-
42
-
43
-
44
-
 45
45 -
 46
46 -
 47
47 -
 48
48 -
 49
49 -
 50
50 -
 51
51 -
 52
52 -
 53
53 -
 54
54 -
 55
55 -
 56
56 -
 57
57 -
 58
58 -
 59
59 -
 60
60 -
 61
61 -
 62
62 -
 63
63 -
 64
64 -
 65
65 -
66
-
67
-
68
-
69
-
70
-
71
-
72
-
73
-
74
-
75
-
76
-
77
-
78
-
79
-
80
-
81
-
82
-
83
-
84
-
85
-
86
-
87
-
88
-
89
-
90
-
91
-
92
-
93
-
94
-
95
-
96
-
97
-
98
-
99
-
100
-
101
 |
 |

108 2 0 1 0 H T C A N N U A L R E P O R T 109
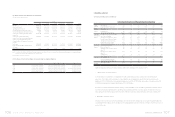
FINANCIAL INFORMATION
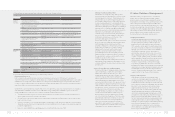
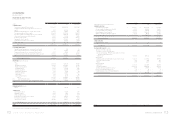
3. Profitability Analysis
Consumers are increasingly recognizing the value of HTC’s innovation and the HTC brand. The market success of many flagship
products launched in 2010 helped grow revenues by 90% and net income by 75% to new historic highs. Earnings per share (EPS)
rose to NT$48.49. Operating income and pre-tax income to paid-in capital ratios rose by 517% and 544%, respectively. Return on
equity (ROE) rose to 56% from 37% in 2009.
4. Cash Flow Analysis
Reflecting strong business growth, net cash flows from operating activities grew 48% over 2009 levels to NT$40.8 billion. Current
liabilities also rose 103%, resulting in a 37% reduction in our 2010 cash flow ratio. During 2010 HTC continued expanding production
capacity and oce space to meet anticipated future growth. This, coupled with increased inventory levels necessary to meet
market demand, reduced the cash flow adequacy ratio to 157%. Cash flow reinvestment ratio rose to 26% due to a 179% rise in the
numerator (net cash flows from operating activity – cash dividends) due to a 48% growth in net cash flows from operating activities
and a similar cash dividend payments compared to 2009.
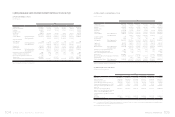
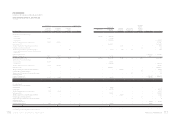
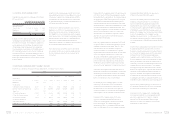
(2) Financial Analysis (Consolidated)
Year
Item (Note 2~3) 2010 2009 2008 2007(Note 1) 2006(Note 1) As of 2011.3.31
Capital
Structure
Analysis
Debt Ratio (%) 61 45 48 39 36 59
Long-term Fund to Fixed Assets
Ratio (%)
533 664 681 1,333 1,347 615
Liquidity
Analysis
Current Ratio (%) 146 195 190 244 264 148
Quick Ratio (%) 120 176 171 217 230 121
Times Interest Earned (Times) 12,624 11,683 3,041 26,595 90,413 6,983
Operating
Performance
Analysis
Average Collection Turnover (Times) 6.14 6.03 6.12 6.06 6.25 6.65
Days Sales Outstanding 59 61 60 60 58 55
Average Inventory Turnover (Times) 10.06 11.46 10.95 9.68 11.34 9.27
Average Payment Turnover (Times) 4.35 4.03 3.92 3.66 4.65 4.49
Average Inventory Turnover Days 36 32 33 38 32 39
Fixed Assets Turnover (Times) 19.88 14.60 17.09 28.01 33.23 28.54
Total Assets Turnover (Times) 1.46 1.21 1.32 1.29 1.59 1.88
Profitability
Analysis
Return on Total Assets (%) 26 21 28 37 47 29
Return on Equity (%) 56 37 49 58 77 72
Operating Income to Paid-in Capital
Ratio (%)
540 312 402 535 590 201
Pre-tax Income to Paid-in Capital
Ratio (%)
550 322 420 562 617 209
Net Margin (%) 14 16 19 24 24 14
Basic Earnings Per Share (NT$) 48.49 27.35 34.44 34.74 30.07 18.36
Cash Flow Cash Flow Ratio (%) 40 52 68 113 104 18
Cash Flow Adequacy Ratio (%) 150 192 211 273 271 153
Cash Flow Reinvestment Ratio (%) 32 11 28 47 43 25
Leverage Operating Leverage 1.43 1.54 1.44 1.20 1.16 1.35
Financial Leverage 1.00 1.00 1.00 1.00 1.00 1.00
Significant changes in various performance indicators reflected the doubling of HTC’s business in 2010.
1. Capital Structure & Liquidity Analyses
As of year-end 2010, our debt ratio stood higher at 61% while current and quick ratios were both lower at 146% and 120%,
respectively. This situation reflected increases in current liabilities due to rapid business growth that saw notes and accounts
payable rise 149% to NT$63.9 billion, accrued marketing expense rise 97% to NT$17.3 billion, accrued bonus to employees rise 75%
to NT$8.5 billion, and product warranty liabilities grow 73% to NT$9.1 billion.
2. Operating Performance Analysis
Fixed asset turnover and total asset turnover were all higher due to strong revenue growth. Days sales outstanding fell to 59 days
in 2010. Average inventory turnover days increased to 36 days due to aggressive increases of inventory to meet strong market
demand and higher inventory amount in transit at 2010 year-end.
3. Profitability Analysis
Consumers are increasingly recognizing the value of HTC’s innovation and the HTC brand. The market success of many flagship
products launched in 2010 helped grow revenues by 93% and net income by 75% to new historic highs. Earnings per share (EPS)
rose to NT$48.49. Operating income and pre-tax income to paid-in capital ratios rose by 540% and 550%, respectively. Return on
total asset (ROA) and Return on equity (ROE) rose to 26% and 56% from 21% and 37% in 2009, respectively.
4. Cash Flow Analysis
Reflecting strong business growth, net cash flows from operating activities grew 66% over 2009 levels to NT$46.0 billion. Current
liabilities also rose 115%, resulting in a 40% reduction in our 2010 cash flow ratio. During 2010 HTC and its subsidiaries continued
expanding production capacity and oce space to meet anticipated future growth. This, coupled with increased inventory levels
necessary to meet market demand, reduced the cash flow adequacy ratio to 150%. Cash flow reinvestment ratio rose to 32% due to
a 241% rise in the numerator (net cash flows from operating activity – cash dividends) due to a 66% growth in net cash flows from
operating activities and a similar cash dividend payments compared to 2009.
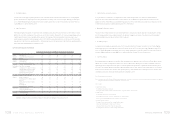
Note 1: Excluded employee bonus expenses
Note 2: In accordance with 2008, 2009 and 2010 financial reporting requirements, write-downs of inventories or reversal of write-downs and product warranty costs registered
during the period 2006 to 2007 have been reclassified as cost of revenues items.
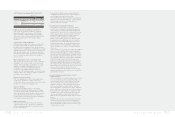
Note 3: Glossary
a. Capital Structure Analysis
(1) Debt Ratio=Total Liabilities / Total Assets.
(2) Long-term Fund to Fixed Assets Ratio=(Shareholders' Equity + Long-term Liabilities) / Net Fixed Assets.
b. Liquidity Analysis
(1) Current Ratio=Current Assets / Current Liabilities.
(2) Quick Ratio:(Current Assets - Inventories - Prepaid Expenses) / Current Liabilities.
(3) Times Interest Earned:Earnings before Interest and Taxes / Interest Expenses.
c. Operating Performance Analysis
(1) Average Collection Turnover: Net Sales / Average Trade Receivables.
(2) Days Sales Outstanding: 365 / Average Collection Turnover.
(3) Average Inventory Turnover:Cost of Sales / Average Inventory.
(4) Average Payment Turnover=Cost of Sales / Average Trade Payables.