HTC 2010 Annual Report Download - page 88
Download and view the complete annual report
Please find page 88 of the 2010 HTC annual report below. You can navigate through the pages in the report by either clicking on the pages listed below, or by using the keyword search tool below to find specific information within the annual report.-
 1
1 -
2
-
3
-
4
-
5
-
6
-
7
-
8
-
9
-
10
-
11
-
12
-
13
-
14
-
15
-
16
-
17
-
18
-
19
-
20
-
21
-
22
-
23
-
24
-
25
-
26
-
27
-
28
-
29
-
30
-
31
-
32
-
33
-
34
-
35
-
36
-
37
-
38
-
39
-
40
-
41
-
42
-
43
-
44
-
45
-
46
-
47
-
48
-
49
-
50
-
51
-
52
-
53
-
54
-
55
-
56
-
57
-
58
-
59
-
60
-
61
-
62
-
63
-
64
-
65
-
66
-
67
-
68
-
69
-
70
-
71
-
72
-
73
-
74
-
75
-
76
-
77
-
 78
78 -
 79
79 -
 80
80 -
 81
81 -
 82
82 -
 83
83 -
 84
84 -
 85
85 -
 86
86 -
 87
87 -
 88
88 -
 89
89 -
 90
90 -
 91
91 -
 92
92 -
 93
93 -
 94
94 -
 95
95 -
 96
96 -
 97
97 -
 98
98 -
99
-
100
-
101
 |
 |

174 2 0 1 0 H T C A N N U A L R E P O R T 175
FINANCIAL INFORMATION
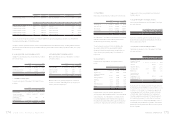
6. AVAILABLE-FOR-SALE FINANCIAL ASSETS
Available-for-sale financial assets as of December 31, 2009 and
2010 were as follows:
2009 2010
NT$ NT$ US$(Note 3)
Mutual funds $ 2,497,394 $ 441,948 $ 15,172
Domestic quoted stocks 313 538 18
Less: Current portion ( 2,497,394) ( 441,948) ( 15,172)
$ 313 $ 538 $ 18
7. ACCOUNTS RECEIVABLE
Accounts receivable as of December 31, 2009 and 2010 were
as follows:
2009 2010
NT$ NT$ US$(Note 3)
Notes receivable $ 2,337 $ - $ -
Accounts receivable 28,146,109 62,620,703 2,149,697
Accounts receivable from
related parties 792 2,143 74
Less: Allowance for
doubtful accounts ( 1,023,629) ( 1,008,491) ( 34,620)
$ 27,125,609 $ 61,614,355 $ 2,115,151
8. OTHER CURRENT FINANCIAL ASSETS
Other current financial assets as of December 31, 2009 and
2010 were as follows:
2009 2010
NT$ NT$ US$(Note 3)
Other receivables $ 207,054 $ 747,983 $ 25,677
Interest receivables 11,463 11,376 391
Agency payments 37,531 22,139 760
Other 2,426 2,042 70
$ 258,474 $ 783,540 $ 26,898
Other receivables were primarily prepayments on behalf of
vendors or customers, withholding income tax of employees’
bonuses, and other compensation.
9. INVENTORIES
Inventories as of December 31, 2009 and 2010 were as follows:
2009 2010
NT$ NT$ US$(Note 3)
Finished goods $ 1,002,841 $ 1,859,010 $ 63,818
Work-in-process 1,210,132 6,707,423 230,258
Raw materials 3,173,012 13,075,800 448,877
Goods in transit 650,222 4,771,514 163,801
$ 6,036,207 $ 26,413,747 $ 906,754
As of December 31, 2009 and 2010, the allowance for inventory
devaluation was NT$2,770,551 thousand and NT$3,535,521
thousand (US$121,370 thousand), respectively.
The write-down of inventories to their net realizable value
amounted to NT$1,853,579 thousand and NT$2,686,168
thousand (US$92,213 thousand) and was recognized as cost
of sales for the years ended December 31, 2009 and 2010,
respectively.
10. PREPAYMENTS
Prepayments as of December 31, 2009 and 2010 were as
follows:
2009 2010
NT$ NT$ US$(Note 3)
Royalty $ 3,044,563 $ 1,870,381 $ 64,208
Net input VAT 15,301 361,152 12,398
Software and hardware
maintenance 85,797 115,425 3,962
Molding equipment 37,052 91,058 3,126
Marketing 41,707 66,295 2,276
Rent 15,318 40,812 1,401
Materials purchases 13,084 38,990 1,338
Others 88,827 69,665 2,392
$ 3,341,649 $ 2,653,778 $ 91,101
Prepayments for royalty were primarily prepayments for
discount purpose and classified as current or noncurrent based
on their maturities. As of December 31, 2009 and 2010, the
noncurrent prepayments were NT$1,843,170 thousand and
NT$2,484,156 thousand (US$85,279 thousand) were classified
as other assets, respectively (Note 29 has more information).
Prepayments for others were primarily for rent, travel and
insurance expenses.
11. HELD-TO-MATURITY FINANCIAL ASSETS
Held-to-maturity financial assets as of December 31, 2009 and
2010 were as follows:
2009 2010
NT$ NT$ US$(Note 3)
Corporate bonds $ - $ 207,946 $ 7,139
In 2010, the Company bought the corporate bonds issued
by Nan Ya Plastics Corporation and maturing in 2013 with an
eective interest rate of 0.90%.
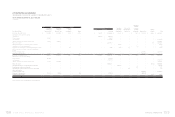
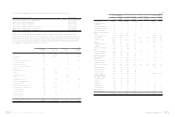
12. FINANCIAL ASSETS CARRIED AT COST
Financial assets carried at cost as of December 31, 2009 and
2010 were as followss:
2009 2010
NT$ NT$ US$(Note 3)
Hua-Chuang Automobile
Information Technical
Center Co., Ltd. $ 500,000 $ 500,000 $ 17,164
GSUO Inc. -145,650 2,000
NETQIN MOBILE Inc. -72,825 2,500
SoundHound Inc. 63,980 58,260 5,000
BandRich Inc. -15,861 545
Answer Online, Inc. 1,192 - -
Luminous Optical
Technology Co., Ltd. 183,000 6,282
Prepayments for long-
term investments -48,065 1,650
$ 565,172 $ 1,023,661 $ 35,141
In January 2007, the Company acquired 10% equity interest in
Hua-Chuang Automobile Information Technical Center Co., Ltd.
for NT$500,000 thousand. The Company also signed a joint
venture agreement with Yulon Group, the main stockholder
of Hua-Chuang. Under the agreement, the Company and
Yulon Group may, between January 1, 2010 and December 31,
2011, submit written requests to each other for Yulon Group
to buy back NT$300,000 thousand at original price, some of
Hua-Chuang’s shares bought by the Company. The buy-back
proposed by Yulon Group becomes eective with a consensus
from the Company.
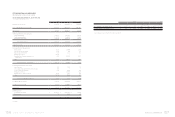
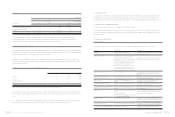
2009
Buy/Sell Currency Settlement Period/Date Contract Amount
Forward exchange contracts Sell EUR/USD 2010.01.15-2010.02.26 EUR 76,000
2010
Buy/Sell Currency Settlement Period/Date Contract Amount
Forward exchange contracts Buy USD/CAD 2011.01.26 USD 250
Forward exchange contracts Buy USD/JPY 2011.01.12-2011.02.23 USD 18,187
Forward exchange contracts Sell EUR/USD 2011.01.05-2011.03.18 EUR 531,000
Forward exchange contracts Sell GBP/USD 2011.01.12-2011.03.25 GBP 57,400
Forward exchange contracts Sell USD/TWD 2011.01.03-2010.01.31 USD 447,000
Net loss on derivative financial instruments in 2009 was NT$749,476 thousand, including realized settlement loss of NT$767,608
thousand and valuation gain of NT$18,132 thousand.
Net gain on derivative financial instruments in 2010 was NT$759,889 thousand (US$26,086 thousand), including realized settlement
gain of NT$309,613 thousand (US$10,629 thousand) and valuation gain of NT$450,276 thousand (US$15,457 thousand). Note 23 has
more information.