HTC 2010 Annual Report Download - page 79
Download and view the complete annual report
Please find page 79 of the 2010 HTC annual report below. You can navigate through the pages in the report by either clicking on the pages listed below, or by using the keyword search tool below to find specific information within the annual report.-
 1
1 -
2
-
3
-
4
-
5
-
6
-
7
-
8
-
9
-
10
-
11
-
12
-
13
-
14
-
15
-
16
-
17
-
18
-
19
-
20
-
21
-
22
-
23
-
24
-
25
-
26
-
27
-
28
-
29
-
30
-
31
-
32
-
33
-
34
-
35
-
36
-
37
-
38
-
39
-
40
-
41
-
42
-
43
-
44
-
45
-
46
-
47
-
48
-
49
-
50
-
51
-
52
-
53
-
54
-
55
-
56
-
57
-
58
-
59
-
60
-
61
-
62
-
63
-
64
-
65
-
66
-
67
-
68
-
 69
69 -
 70
70 -
 71
71 -
 72
72 -
 73
73 -
 74
74 -
 75
75 -
 76
76 -
 77
77 -
 78
78 -
 79
79 -
 80
80 -
 81
81 -
 82
82 -
 83
83 -
 84
84 -
 85
85 -
 86
86 -
 87
87 -
 88
88 -
 89
89 -
90
-
91
-
92
-
93
-
94
-
95
-
96
-
97
-
98
-
99
-
100
-
101
 |
 |

156 2 0 1 0 H T C A N N U A L R E P O R T 157
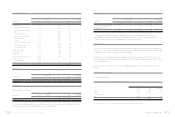
FINANCIAL INFORMATION
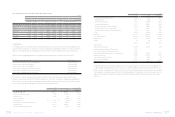
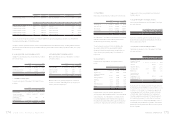
HTC CORPORATION AND SUBSIDIARIES
CONSOLIDATED STATEMENTS OF INCOME
YEARS ENDED DECEMBER 31, 2009 AND 2010
(In Thousands, Except Earnings Per Share)
2009 2010
NT$ NT$ US$(Note3)
REVENUES (Notes 2 and 26) $ 144,492,518 $ 278,761,244 $ 9,569,559
COST OF REVENUES (Notes 9, 22 and 26) 98,329,537 194,892,505 6,690,440
GROSS PROFIT 46,162,981 83,868,739 2,879,119
OPERATING EXPENSES (Notes 22 and 26)
Selling and marketing 10,863,175 21,757,601 746,914
General and administrative 2,304,364 5,038,543 172,967
Research and development 8,372,535 12,940,014 444,216
Total operating expenses 21,540,074 39,736,158 1,364,097
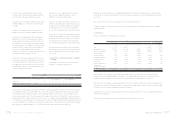
OPERATING INCOME 24,622,907 44,132,581 1,515,022
NONOPERATING INCOME AND GAINS
Interest income 362,136 313,888 10,775
Gains on disposal of properties 2,984 879 30
Gains on sale of investments 3,035 3,001 103
Exchange gain (Note 2) 558,985 - -
Valuation gains on financial instruments, net 18,132 450,276 15,457
(Notes 2 and 5)
Other 474,814 374,900 12,871
Total nonoperating income and gains 1,420,086 1,142,944 39,236
NONOPERATING EXPENSES AND LOSSES
Interest expense 2,174 3,562 122
Loss on equity-method investments (Notes 2 and 13) 3,891 - -
Losses on disposal of properties 2,576 13,066 449
Exchange loss (Note 2) -214,679 7,370
Impairment losses (Notes 2, 12 and 13) 78,946 32,771 1,125
Other 558,994 47,059 1,615
Total nonoperating expenses and losses 646,581 311,137 10,681
INCOME BEFORE INCOME TAX 25,396,412 44,964,388 1,543,577
INCOME TAX (Notes 2 and 23) ( 2,781,999) ( 5,449,544) ( 187,077)
NET INCOME $ 22,614,413 $ 39,514,844 $ 1,356,500
ATTRIBUTABLE TO
Stockholders of the parent $ 22,608,902 $ 39,533,600 $ 1,357,143
Minority interest 5,511 ( 18,756) ( 643)
$ 22,614,413 $ 39,514,844 $ 1,356,500
(Continued)
2009 2010
Before Income Tax After Income Tax Before Income Tax After Income Tax
NT$ NT$ NT$ US$ (Note 3) NT$ US$ (Note 3)
BASIC EARNINGS PER SHARE (Note 24) $ 30.50 $ 27.35 $ 54.57 $ 1.87 $ 48.49 $ 1.66
DILUTED EARNINGS PER SHARE (Note 24) $ 29.95 $ 26.86 $ 53.90 $ 1.85 $ 47.89 $ 1.64
The accompanying notes are an integral part of the financial statements.