HTC 2010 Annual Report Download - page 60
Download and view the complete annual report
Please find page 60 of the 2010 HTC annual report below. You can navigate through the pages in the report by either clicking on the pages listed below, or by using the keyword search tool below to find specific information within the annual report.-
 1
1 -
2
-
3
-
4
-
5
-
6
-
7
-
8
-
9
-
10
-
11
-
12
-
13
-
14
-
15
-
16
-
17
-
18
-
19
-
20
-
21
-
22
-
23
-
24
-
25
-
26
-
27
-
28
-
29
-
30
-
31
-
32
-
33
-
34
-
35
-
36
-
37
-
38
-
39
-
40
-
41
-
42
-
43
-
44
-
45
-
46
-
47
-
48
-
49
-
 50
50 -
 51
51 -
 52
52 -
 53
53 -
 54
54 -
 55
55 -
 56
56 -
 57
57 -
 58
58 -
 59
59 -
 60
60 -
 61
61 -
 62
62 -
 63
63 -
 64
64 -
 65
65 -
 66
66 -
 67
67 -
 68
68 -
 69
69 -
 70
70 -
71
-
72
-
73
-
74
-
75
-
76
-
77
-
78
-
79
-
80
-
81
-
82
-
83
-
84
-
85
-
86
-
87
-
88
-
89
-
90
-
91
-
92
-
93
-
94
-
95
-
96
-
97
-
98
-
99
-
100
-
101
 |
 |

118 2 0 1 0 H T C A N N U A L R E P O R T 119
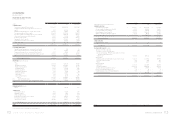
FINANCIAL INFORMATION
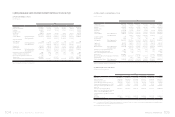
HTC CORPORATION
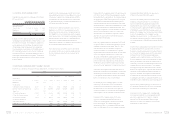
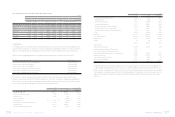
STATEMENTS OF CASH FLOWS
YEARS ENDED DECEMBER 31, 2009 AND 2010
(In Thousands)
2009 2010
NT$ NT$ US$(Note3)
CASH FLOWS FROM OPERATING ACTIVITIES
Net income $ 22,608,902 $ 39,533,600 $ 1,357,143
Adjustments to reconcile net income to net cash provided by
operating activities
Depreciation (including depreciation of assets leased to others) 633,950 622,438 21,368
Amortization 39,847 58,621 2,012
Amortization of premium on financial assets -385 13
Prepaid pension costs ( 20,515) ( 21,293) ( 731)
Gains on equity-method investments ( 273,811) ( 1,457,395) ( 50,031)
Cash dividends received from equity-method investees 905 480 17
(Gain) loss on disposal of properties, net ( 2,984) 139 5
Transfer of properties to expenses 7,021 532 18
Gains on sale of investments, net ( 3,035) ( 3,001) ( 103)
Impairment losses 30,944 1,192 41
Deferred income tax assets ( 503,703) ( 1,467,669) ( 50,383)
Net changes in operating assets and liabilities
Financial instruments at fair value through profit or loss ( 532,215) ( 432,144) ( 14,835)
Accounts receivable 3,534,014 ( 9,852,810) ( 338,236)
Accounts receivable from related parties ( 1,305,780) ( 25,941,841) ( 890,554)
Other current financial assets 41,305 ( 483,435) ( 16,596)
Inventories 2,201,274 ( 16,703,299) ( 573,405)
Prepayments ( 2,095,767) 1,003,874 34,462
Other current assets 35,227 ( 330,274) ( 11,338)
Other assets - other ( 1,843,170) ( 640,985) ( 22,004)
Notes and accounts payable ( 2,603,301) 33,145,784 1,137,858
Accounts payable - related parties 56,973 1,261,305 43,299
Income tax payable 214,879 2,264,043 77,722
Accrued expenses 6,432,196 16,322,342 560,327
Other current liabilities 888,452 3,955,215 135,778
Net cash provided by operating activities 27,541,608 40,835,804 1,401,847
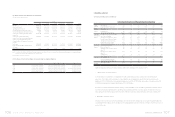
CASH FLOWS FROM INVESTING ACTIVITIES
Purchase of available-for-sale financial assets ( 8,105,512) ( 3,551,180) ( 121,908)
Proceeds of the sale of available-for-sale financial assets 5,611,153 5,610,175 192,591
Purchase of held-to-maturity financial assets -( 208,331) ( 7,152)
Increase in investments accounted for by the equity method ( 1,164,135) ( 3,031,907) ( 104,082)
Purchase of properties and assets leased to others ( 1,426,671) ( 3,004,250) ( 103,133)
Proceeds of the sale of properties 4,005 - -
Decrease (increase) in refundable deposits 48,298 ( 10,031) ( 344)
Increase in deferred charges ( 57,495) ( 4,144) ( 142)
Increase in restricted assets ( 63,900) - -
Increase in intangible assets -( 220,943) ( 7,585)
Net cash used in investing activities ( 5,154,257) ( 4,420,611) ( 151,755)
CASH FLOWS FROM FINANCING ACTIVITIES
Decrease in guarantee deposits received ( 5,196) ( 582) ( 20)
Cash dividends ( 20,125,634) ( 20,122,332) ( 690,777)
Purchase of treasury stock ( 2,406,930) ( 11,686,667) ( 401,190)
Net cash used in financing activities ( 22,537,760) ( 31,809,581) ( 1,091,987)
NET (DECREASE) INCREASE IN CASH AND CASH EQUIVALENTS ( 150,409) 4,605,612 158,105
2009 2010
NT$ NT$ US$(Note3)
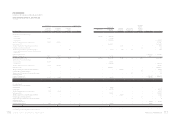
CASH AND CASH EQUIVALENTS, BEGINNING OF YEAR 61,826,873 61,676,464 2,117,284
CASH AND CASH EQUIVALENTS, END OF YEAR $ 61,676,464 $ 66,282,076 $ 2,275,389
SUPPLEMENTAL CASH FLOW INFORMATION
Cash paid during the year
Interest (net of amounts capitalized) $ 131 $ 46 $ 2
Income tax $
2,892,386 $
4,161,335 $ 142,854
NONCASH INVESTING AND FINANCING ACTIVITIES
Transfer of retained earnings to stock dividends for distribution $ 372,697 $ 386,968 $
13,284
Transfer of assets leased to others to properties $ 261,824 $ 47,813 $
1,641
Retirement of treasury stock $ 5,817,207 $ 4,834,174 $
165,952
Transfer of stock bonuses to employees to common stock and
additional paid-in capital $ 4,954,889 $ 1,943,694 $
66,725
INCREASE IN LONG-TERM INVESTMENTS - EQUITY METHOD
Increase in investments accounted for by the equity method $ 1,137,873 $ 2,976,349 $
102,175
Decrease in payable for purchase of investments 26,262 55,558 1,907
Cash paid for increase in long-term investments $ 1,164,135 $ 3,031,907 $
104,082
PURCHASE OF PROPERTIES AND ASSETS LEASED TO OTHERS
Cost of properties and assets leased to others purchased $ 1,336,787 $ 3,252,855 $ 111,667
Decrease (increase) in payable for purchase of equipment 88,880 ( 249,681) ( 8,571)
Decrease in lease payable 1,004 1,076 37
Cash paid for purchase of properties and assets leased to others $ 1,426,671 $ 3,004,250 $ 103,133
The accompanying notes are an integral part of the financial statements. (Concluded)
(Continued)