HTC 2010 Annual Report Download - page 64
Download and view the complete annual report
Please find page 64 of the 2010 HTC annual report below. You can navigate through the pages in the report by either clicking on the pages listed below, or by using the keyword search tool below to find specific information within the annual report.-
 1
1 -
2
-
3
-
4
-
5
-
6
-
7
-
8
-
9
-
10
-
11
-
12
-
13
-
14
-
15
-
16
-
17
-
18
-
19
-
20
-
21
-
22
-
23
-
24
-
25
-
26
-
27
-
28
-
29
-
30
-
31
-
32
-
33
-
34
-
35
-
36
-
37
-
38
-
39
-
40
-
41
-
42
-
43
-
44
-
45
-
46
-
47
-
48
-
49
-
50
-
51
-
52
-
53
-
 54
54 -
 55
55 -
 56
56 -
 57
57 -
 58
58 -
 59
59 -
 60
60 -
 61
61 -
 62
62 -
 63
63 -
 64
64 -
 65
65 -
 66
66 -
 67
67 -
 68
68 -
 69
69 -
 70
70 -
 71
71 -
 72
72 -
 73
73 -
 74
74 -
75
-
76
-
77
-
78
-
79
-
80
-
81
-
82
-
83
-
84
-
85
-
86
-
87
-
88
-
89
-
90
-
91
-
92
-
93
-
94
-
95
-
96
-
97
-
98
-
99
-
100
-
101
 |
 |

126 2 0 1 0 H T C A N N U A L R E P O R T 127
FINANCIAL INFORMATION
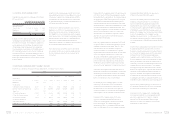
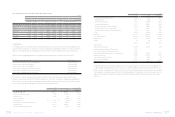
6. AVAILABLE-FOR-SALE FINANCIAL ASSETS
Available-for-sale financial assets as of December 31, 2009 and
2010 were as follows:
2009 2010
NT$ NT$ US$(Note 3)
Mutual funds $ 2,497,394 $ 441,948 $ 15,172
Domestic quoted stocks 313 538 18
Less: Current portion ( 2,497,394) ( 441,948) ( 15,172)
$ 313 $ 538 $ 18
7. ACCOUNTS RECEIVABLE
Accounts receivable as of December 31, 2009 and 2010 were
as follows:
2009 2010
NT$ NT$ US$(Note 3)
Accounts receivable $ 26,334,719 $ 36,187,529 $ 1,242,277
Less: Allowance for
doubtful accounts ( 1,008,491) ( 1,008,491) ( 34,620)
$ 25,326,228 $ 35,179,038 $ 1,207,657
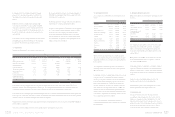
8. OTHER CURRENT FINANCIAL ASSETS
Other current financial assets as of December 31, 2009 and
2010 were as follows:
2009 2010
NT$ NT$ US$(Note 3)
Othe receivables $ 118,321 $ 641,609 $ 22,026
Other receivables from
related parties (Note 24) 81,137 36,185 1,242
Agency payments 23,517 28,610 982
Interest receivables 11,226 11,232 385
$ 234,201 $ 717,636 $ 24,635
Other receivables were primarily prepayments on behalf of
vendors or customers, withholding income tax of employees’
bonuses, and other compensation.
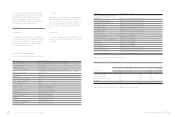
9. INVENTORIES
Inventories as of December 31, 2009 and 2010 were as follows:
2009 2010
NT$ NT$ US$(Note 3)
Finished goods $ 779,104 $ 809,469 $ 27,788
Work-in-process 1,132,685 5,408,003 185,651
Raw materials 2,687,391 11,272,675 386,978
Goods in transit 618,013 4,430,345 152,089
$ 5,217,193 $ 21,920,492 $ 752,506
As of December 31, 2009 and 2010, the allowance for inventory
devaluation was NT$2,646,767 thousand and NT$3,436,697
thousand (US$117,978 thousand), respectively.
The write-down of inventories to their net realizable value
amounted to NT$1,934,360 thousand and NT$1,297,811
thousand (US$44,552 thousand) and was recognized as cost
of sales for the years ended December 31, 2009 and 2010,
respectively.
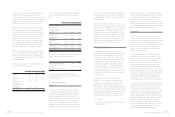
10. PREPAYMENTS
Prepayments as of December 31, 2009 and 2010 were as
follows:
2009 2010
NT$ NT$ US$(Note 3)
Royalty $ 3,044,563 $ 1,870,381 $ 64,208
Services 121,600 166,781 5,725
Marketing 10,410 66,295 2,276
Software and hardware
maintenance 68,937 94,871 3,257
Molding equipment 37,052 91,058 3,126
Others 68,929 58,231 1,999
$ 3,351,491 $ 2,347,617 $ 80,591
Prepayments for royalty were primarily prepayments for
discount purpose and classified as current or noncurrent based
on their maturities. As of December 31, 2009 and 2010, the
noncurrent prepayments were NT$1,843,170 thousand and
NT$2,484,156 thousand (US$85,279 thousand) were classified
as other assets, respectively (Note 27 has more information).
Prepayments for others were primarily for rent, travel and
insurance expenses.
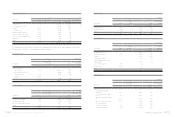
11. HELD-TO-MATURITY FINANCIAL ASSETS
Held-to-maturity financial assets as of December 31, 2009 and
2010 were as follows:
2009 2010
NT$ NT$ US$(Note 3)
Corporate bonds $ - $ 207,946 $ 7,139
In 2010, the Company bought the corporate bonds issued
by Nan Ya Plastics Corporation and maturing in 2013 with an
eective interest rate of 0.90%.
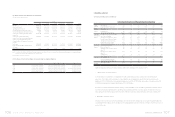
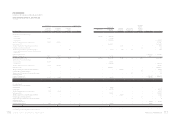
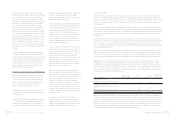
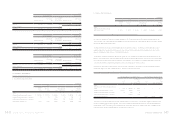
Forward Exchange Contracts
2009
Buy/Sell Currency Settlement Period/Date Contract Amount
Forward exchange contracts Sell EUR/USD 2010.01.15-2010.02.26 EUR 76,000
2010
Buy/Sell Currency Settlement Period/Date Contract Amount
Forward exchange contracts Buy USD/CAD 2011.01.26 USD 250
Forward exchange contracts Buy USD/JPY 2011.01.12-2011.02.23 USD 18,187
Forward exchange contracts Sell EUR/USD 2011.01.05-2011.03.18 EUR 531,000
Forward exchange contracts Sell GBP/USD 2011.01.12-2011.03.25 GBP 57,400
Forward exchange contracts Sell USD/TWD 2011.01.03-2010.01.31 USD 447,000
Net loss on derivative financial instruments in 2009 was NT$749,476 thousand, including realized settlement loss of NT$767,608
thousand and valuation gain of NT$18,132 thousand.
Net gain on derivative financial instruments in 2010 was NT$759,889 thousand (US$26,086 thousand), including realized settlement
gain of NT$309,613 thousand (US$10,629 thousand) and valuation gain of NT$450,276 thousand (US$15,457 thousand). Note 23 has
more information.