HTC 2010 Annual Report Download - page 74
Download and view the complete annual report
Please find page 74 of the 2010 HTC annual report below. You can navigate through the pages in the report by either clicking on the pages listed below, or by using the keyword search tool below to find specific information within the annual report.-
 1
1 -
2
-
3
-
4
-
5
-
6
-
7
-
8
-
9
-
10
-
11
-
12
-
13
-
14
-
15
-
16
-
17
-
18
-
19
-
20
-
21
-
22
-
23
-
24
-
25
-
26
-
27
-
28
-
29
-
30
-
31
-
32
-
33
-
34
-
35
-
36
-
37
-
38
-
39
-
40
-
41
-
42
-
43
-
44
-
45
-
46
-
47
-
48
-
49
-
50
-
51
-
52
-
53
-
54
-
55
-
56
-
57
-
58
-
59
-
60
-
61
-
62
-
63
-
 64
64 -
 65
65 -
 66
66 -
 67
67 -
 68
68 -
 69
69 -
 70
70 -
 71
71 -
 72
72 -
 73
73 -
 74
74 -
 75
75 -
 76
76 -
 77
77 -
 78
78 -
 79
79 -
 80
80 -
 81
81 -
 82
82 -
 83
83 -
 84
84 -
85
-
86
-
87
-
88
-
89
-
90
-
91
-
92
-
93
-
94
-
95
-
96
-
97
-
98
-
99
-
100
-
101
 |
 |

146 2 0 1 0 H T C A N N U A L R E P O R T 147
FINANCIAL INFORMATION
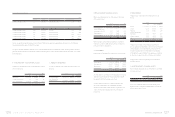
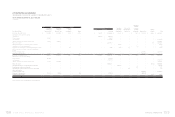
HTC Brasil $ - - $ 37,462 $ 1,286 -
Communication Global Certification
Inc. - - 31,886 1,095 -
HTC Nordic ApS. - - 30,803 1,057 -
HTC America Innovation Inc. - - 27,484 944 -
HTC (Thailand) Limited 9,064 - 18,903 649 -
HTC America Inc. 401,564 3 - - -
High Tech Computer Singapore Pte. Ltd. 22,550 - - - -
Others 23,716 - 129,218 4,436 1
$ 1,277,205 7 $ 1,622,014 $ 55,682 5
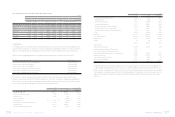
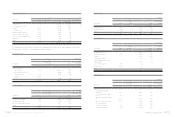
Other Payables to Related Parties
December 31
2009 2010
Related Party Amount
% to Total Other
Payables Amount
% to Total Other
Payables
NT$ NT$ US$ (Note 3)
HTC America Inc. $ 317,708 35 $ 173,961 $ 5,972 28
HTC America Innovation Inc. - - 113,407 3,893 19
HTC EUROPE CO, LTD. 83,509 9 87,266 2,996 15
High Tech Computer Asia Pacific Pte.
Ltd. 96,438 11 47,335 1,625 8
HTC Corporation (Shanghai WGQ) 15,470 2 25,802 886 4
HTC Nippon Corporation 7,069 1 7,084 243 1
High Tech Computer (H.K.) Limited 6,776 1 183 6 -
Others 4,797 - 21,198 728 4
$ 531,767 59 $ 476,236 $ 16,349 79
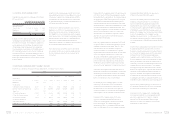
Advance Receipts
December 31
2009 2010
Related Party Amount
% to Total Advance
Receipts Amount
% to Total Advance
Receipts
NT$ NT$ US$ (Note 3)
BandRich Inc. $ 61,358 11 $ - $ - -
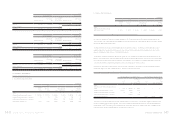
Outsourcing Expenses
2009 2010
Related Party Amount
% to Total Outsourcing
Expenses Amount
% to Total Outsourcing
Expenses
NT$ NT$ US$ (Note 3)
HTC Electronics (Shanghai) $ 306,410 95 $ 11,010,333 $ 377,972 95
High Tech Computer Corp. (Suzhou) 3,775 1 - - -
$ 310,185 96 $ 11,010,333 $ 377,972 95
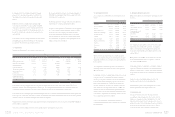
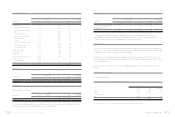
Warranty Expenses
2009 2010
Related Party Amount
% to Total Warranty
Expenses Amount
% to Total Warranty
Expenses
NT$ NT$ US$ (Note 3)
HTC America Inc. $ 1,211,149 22 $ 793,998 $ 27,257 8
HTC Europe Co., Ltd. 319,210 6 275,025 9,441 3
HTC Corporation (Shanghai WGQ) 89,358 2 104,176 3,576 1
High Tech Computer Asia Pacific Pte.
Ltd. - - 62,068 2,131 1
High Tech Computer (H.K.) Limited 48,179 1 40,707 1,398 -
Others 31,188 - 37,698 1,294 -
$ 1,699,084 31 $ 1,313,672 $ 45,097 13
Warranty expense resulted from authorizing the above related parties to provide after-sales service.
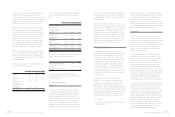
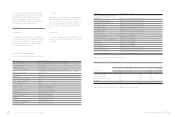
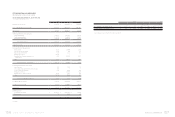
Commission Expenses
2009 2010
Related Party Amount
% to Total
Commission
Expenses Amount
% to Total
Commission
Expenses
NT$ NT$ US$ (Note 3)
HTC Europe Co., Ltd. $ 2,547,351 86 $ 3,674,661 $ 126,147 81
HTC Belgium BVBA/SPRL 424,299 14 528,017 18,126 12
HTC Nordic ApS. - - 91,146 3,129 2
HTC FRANCE CORPORATION - - 76,889 2,640 2
Others - - 151,249 5,192 3
$ 2,971,650 100 $ 4,521,962 $ 155,234 100
Commission expenses resulted from the basis of the nature of services rendered by the related parties.