HTC 2010 Annual Report Download - page 41
Download and view the complete annual report
Please find page 41 of the 2010 HTC annual report below. You can navigate through the pages in the report by either clicking on the pages listed below, or by using the keyword search tool below to find specific information within the annual report.-
 1
1 -
2
-
3
-
4
-
5
-
6
-
7
-
8
-
9
-
10
-
11
-
12
-
13
-
14
-
15
-
16
-
17
-
18
-
19
-
20
-
21
-
22
-
23
-
24
-
25
-
26
-
27
-
28
-
29
-
30
-
 31
31 -
 32
32 -
 33
33 -
 34
34 -
 35
35 -
 36
36 -
 37
37 -
 38
38 -
 39
39 -
 40
40 -
 41
41 -
 42
42 -
 43
43 -
 44
44 -
 45
45 -
 46
46 -
 47
47 -
 48
48 -
 49
49 -
 50
50 -
 51
51 -
52
-
53
-
54
-
55
-
56
-
57
-
58
-
59
-
60
-
61
-
62
-
63
-
64
-
65
-
66
-
67
-
68
-
69
-
70
-
71
-
72
-
73
-
74
-
75
-
76
-
77
-
78
-
79
-
80
-
81
-
82
-
83
-
84
-
85
-
86
-
87
-
88
-
89
-
90
-
91
-
92
-
93
-
94
-
95
-
96
-
97
-
98
-
99
-
100
-
101
 |
 |

80 2 0 1 0 H T C A N N U A L R E P O R T 81
Financial Status, Operating Resul ts And Risk Management
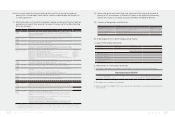
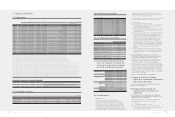
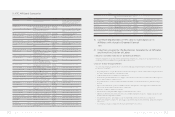
I. Financial Status
Unit:NT$ thousands
Item 2010 2009
Dierence
Amount %
Current Assets 168,639,526 104,900,881 63,738,645 61
Long-term Investments 1,232,145 810,485 421,660 52
Fixed Assets 14,024,329 9,899,808 4,124,521 42
Intangible Assets 935,650 240,482 695,168 289
Other Assets 5,550,094 3,577,361 1,972,733 55
Total Assets 190,381,744 119,429,017 70,952,727 59
Current Liabilities 115,641,103 53,728,775 61,912,328 115
Long-term Liabilities 12,188 24,375 (12,187) (50)
Other Liabilities 13,959 1,210 12,749 1,054
Total Liabilities 115,667,250 53,754,360 61,912,890 115
Capital Stock 8,176,532 7,889,358 287,174 4
Capital Surplus 10,820,744 9,099,923 1,720,821 19
Retained Earnings 63,150,566 48,637,773 14,512,793 30
Equity Adjustments (580,855) 13,396 (594,251) (4,436)
Treasury Stock (6,852,493) 0 (6,852,493) -
Equity Attributable to Stockholders of the Parent 74,714,494 65,640,450 9,074,044 14
Minority Interest 0 34,207 (34,207) (100)
Total Stockholders' Equity 74,714,494 65,674,657 9,039,837 14
* All numbers above are based on consolidated financial statements.
Explanations for any material changes in HTC's assets, liabilities, and shareholders'
equity in the most recent two fiscal years
Capital: 2010 marked a new high water mark for HTC's business with 111% growth in shipment. This raised HTC's current assets by 61% or NT$63.7
billion at the close of 2010. Major increases include NT$9.8 billion more in cash and cash equivalents, NT$34.5 billion more in accounts receivable, and
NT$20.3 billion more in inventory than at year-end 2009. Work continued in 2010 on the new Taoyuan Headquarters campus and Taipei headquarters
building. Additional land and oce space was also purchased nearby the Taipei headquarters property to help ensure adequate oce space over the
long term. HTC also added capacity to plants in Taoyuan and Shanghai to meet market demand. At the close of 2010, HTC's fixed assets were NT$4.1
billion (42%) higher than at year-end 2009. Other assets were primarily noncurrent deferred income tax assets, which rose by NT$1.3 billion (55%)
over year-end 2009. Total assets at the close of 2010 stood at NT$190.3 billion, an increase of NT$71.0 billion or 59% over year-end 2009.
Debt: Aggressive increases of inventory to meet strong 4Q demand and anticipated continued demand growth led to an NT$38.3 billion (149%)
increase in notes and accounts payable at the close of 2010 compared with year-end 2009. Strong business growth spurred rises in associated
liabilities. These included an NT$8.5 billion rise in accrued marketing expense, NT$3.6 billion rise in accrued bonus to employees, and NT$3.8 billion
rise in reserve for warranty expenses. The additional NT$61.9 billion in current liabilities at the end of 2010 as compared to 2009 fueled this year's
115% growth in total liabilities to NT$115.7 billion.
Shareholders' Equity: We attribute the rise in retained earnings this year primarily to 2010's rapid business growth that increased net income by
NT$16.9 billion. Lower equity adjustments for the year were due to exchange rate volatility that reduced cumulative translation adjustments by
NT$590 million from year-end 2009. HTC initiated a share repurchase in early 2010 to protect shareholder equity and spent NT$4.8 billion to
purchase and cancel 15 million HTC shares. During the second half of 2010, HTC spent a further NT$6.9 billion to buy back 9,786,000 treasury shares
for distribution to employees as performance incentive bonuses. At the close of 2010, HTC's total shareholders' equity stood at NT$74.7 billion, a rise
of NT$9.0 billion or 14% over year-end 2009.
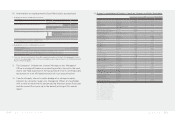
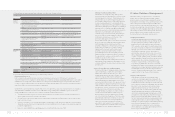
II. Operating Results
Unit:NT$ thousands
Item 2010 2009 Dierence
%
Revenues 278,761,244 144,492,518 134,268,726 93
Cost of Revenues 194,892,505 98,329,537 96,562,968 98
Gross Profit 83,868,739 46,162,981 37,705,758 82
Operating Expenses 39,736,158 21,540,074 18,196,084 84
Operating Income 44,132,581 24,622,907 19,509,674 79
Nonoperating Income and Gains 1,142,944 1,420,086 (277,142) (20)
Nonoperating Expenses and Losses 311,137 646,581 (335,444) (52)
Income From Continuing Operations Before Income Tax 44,964,388 25,396,412 19,567,976 77
Income Tax 5,449,544 2,781,999 2,667,545 96
Income From Continuing Operations 39,514,844 22,614,413 16,900,431 75
Net Income 39,514,844 22,614,413 16,900,431 75
Net Income Attributable to Stockholders of the Parent 39,533,600 22,608,902 16,924,698 75
* All numbers above are based on consolidated financial statements.
Explanations for any material changes in HTC's revenues, operating income, and pre-
tax income in the most recent two fiscal years
We attribute HTC's 111% growth in shipment in 2010 to several popular phone models launched by the Company in 2010 and to
generally strong global demand for smartphones. HTC's operating revenues in 2010 topped NT$278.8 billion, an NT$134.3 billion
(93%) increase over 2009.
We have continuously enhanced operating eciencies and streamlined cost structures as business expands rapidly. HTC's gross
profit grew 82% in 2010 to NT$83.9 billion. Programs to enhance brand recognition for HTC and improve user experience grew
operating expenses by NT$18.2 billion or 84%. Operating income grew this year by NT$19.5 billion (79%) to NT$44.1 billion.
HTC's revenue comes mainly from its primary business. Income from interest, forex gain/loss, and valuation gain/loss on financial
instruments accounted for nearly all non-operating gain/loss. Net non-operating income and gains in 2010 grew 8% to NT$0.8
billion. Net income before tax rose by NT$19.6 billion (77%) to NT$45.0 billion.
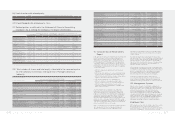
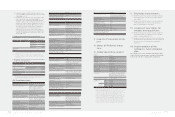
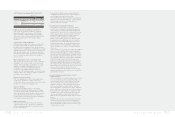
III. Cash Flows
(1) Analysis of change in cash flow for the most recent fiscal year
Item 2010 2009 %
Cash Flow Ratio (%) 40 52 (23)
Cash Flow Adequacy Ratio (%) 150 192 (22)
Cash Flow Reinvestment Ratio (%) 32 11 191
Explanation and analysis of change
Business growth in 2010 expanded annual shipment by 111% resulting in a 66% growth in net cash flow from operating activities to NT$46.0 billion.
Current liabilities saw a corresponding rise by 115% over the previous year, causing the cash flow ratio to decrease to 40%. Continued capacity and
oce expansion by HTC and its aliates to meet anticipated future demand coupled with increased inventories to meet current market demand
reduced cash flow adequacy ratio to 150%. Cash flow reinvestment ratio rose to 32% due to a 241% rise in the numerator (net cash flows from
operating activity – cash dividends) since net cash flow from operating activities increased 66% and cash dividend payments remained at a similar
level compared to 2009.