HTC 2010 Annual Report Download - page 82
Download and view the complete annual report
Please find page 82 of the 2010 HTC annual report below. You can navigate through the pages in the report by either clicking on the pages listed below, or by using the keyword search tool below to find specific information within the annual report.-
 1
1 -
2
-
3
-
4
-
5
-
6
-
7
-
8
-
9
-
10
-
11
-
12
-
13
-
14
-
15
-
16
-
17
-
18
-
19
-
20
-
21
-
22
-
23
-
24
-
25
-
26
-
27
-
28
-
29
-
30
-
31
-
32
-
33
-
34
-
35
-
36
-
37
-
38
-
39
-
40
-
41
-
42
-
43
-
44
-
45
-
46
-
47
-
48
-
49
-
50
-
51
-
52
-
53
-
54
-
55
-
56
-
57
-
58
-
59
-
60
-
61
-
62
-
63
-
64
-
65
-
66
-
67
-
68
-
69
-
70
-
71
-
 72
72 -
 73
73 -
 74
74 -
 75
75 -
 76
76 -
 77
77 -
 78
78 -
 79
79 -
 80
80 -
 81
81 -
 82
82 -
 83
83 -
 84
84 -
 85
85 -
 86
86 -
 87
87 -
 88
88 -
 89
89 -
 90
90 -
 91
91 -
 92
92 -
93
-
94
-
95
-
96
-
97
-
98
-
99
-
100
-
101
 |
 |

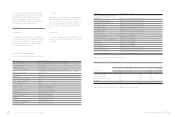
162 2 0 1 0 H T C A N N U A L R E P O R T 163
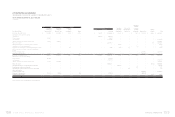
FINANCIAL INFORMATION
HTC CORPORATION AND SUBSIDIARIES
CONSOLIDATED STATEMENTS OF CASH FLOWS
YEARS ENDED DECEMBER 31, 2009 AND 2010
(In Thousands)
2009 2010
NT$ NT$ US$(Note3)
CASH FLOWS FROM OPERATING ACTIVITIES
Net income $ 22,614,413 $ 39,514,844 $ 1,356,500
Adjustments to reconcile net income to net cash provided by operating
activities
Depreciation (including depreciation of assets leased to others) 901,848 905,138 31,072
Amortization 72,614 97,196 3,337
Amortization of premium on financial assets -385 13
Prepaid pension cost ( 20,525 ) ( 21,364 ) ( 733 )
Loss on equity-method investments 3,891 - -
(Gain) loss on disposal of properties and deferred charges, net ( 408 ) 12,187 419
Transfer of properties to expenses 7,474 1,151 39
Gains on sale of investments, net ( 3,035 ) ( 3,001 ) ( 103 )
Impairment losses 78,946 32,771 1,125
Deferred income tax assets ( 506,522 ) ( 1,537,739 ) ( 52,789 )
Net changes in operating assets and liabilities
Financial instruments at fair value through profit or loss ( 532,215 ) ( 432,144 ) ( 14,835 )
Notes and accounts receivable 2,329,169 ( 34,472,524 ) ( 1,183,403 )
Other current financial assets 58,050 ( 547,932 ) ( 18,810 )
Inventories 2,214,130 ( 20,435,168 ) ( 701,516 )
Prepayments ( 2,038,073 ) 683,128 23,451
Other current assets ( 11,552 ) ( 582,339 ) ( 19,991 )
Other assets - other ( 1,843,170 ) ( 640,985 ) ( 22,004 )
Notes and accounts payable ( 2,938,920 ) 38,346,267 1,316,384
Income tax payable 231,349 2,538,408 87,141
Accrued expenses 6,570,007 18,413,894 632,128
Other current liabilities 533,103 4,175,616 143,344
Net cash provided by operating activities 27,720,574 46,047,789 1,580,769
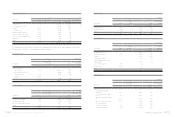
CASH FLOWS FROM INVESTING ACTIVITIES
Purchase of available-for-sale financial assets ( 8,105,512 ) ( 3,551,180 ) ( 121,908 )
Proceeds of the sale of available-for-sale financial assets 5,611,153 5,610,175 192,591
Purchase of held-to-maturity financial assets -( 208,331 ) ( 7,152 )
Increase in financial assets carried at cost ( 64,330 ) ( 234,575 ) ( 8,053 )
Increase in prepayments for long-term investments ( 245,000 ) ( 52,301 ) ( 1,796 )
Acquisition of a subsidiary ( 26,262 ) ( 78,272 ) ( 2,687 )
Purchase of properties and assets leased to others ( 1,910,679 ) ( 4,990,996 ) ( 171,335 )
Proceeds of the sale of properties and deferred charges 70,682 20,064 689
Decrease (increase) in refundable deposits 62,828 ( 21,817 ) ( 749 )
Increase in deferred charges ( 70,099 ) ( 90,721 ) ( 3,114 )
(Increase) decrease in restricted assets ( 64,787 ) 10,564 363
Increase in intangible assets -( 220,943 ) ( 7,585 )
Net cash used in investing activities ( 4,742,006 ) ( 3,808,333 ) ( 130,736 )
2009 2010
NT$ NT$ US$(Note3)
CASH FLOWS FROM FINANCING ACTIVITIES
Decrease in short-term borrowings ( 2,674 ) ( 42,326 ) ( 1,453 )
Decrease in long-term bank loans ( 28,750 ) ( 22,499 ) ( 772 )
(Decrease) increase in guarantee deposits received ( 5,210 ) 12,749 437
Cash dividends ( 20,125,634 ) ( 20,122,332 ) ( 690,777 )
Purchase of treasury stock ( 2,406,930 ) ( 11,686,667 ) ( 401,190 )
Decrease in minority interest -( 15,451 ) ( 530 )
Net cash used in investing activities ( 22,569,198 ) ( 31,876,526 ) ( 1,094,285 )
EFFECT OF EXCHANGE RATE CHANGES ON CASH AND CASH
EQUIVALENTS ( 8,808 ) ( 538,359 ) 18,482 )
NET INCREASE IN CASH AND CASH EQUIVALENTS 400,562 9,824,571 337,266
CASH AND CASH EQUIVALENTS, BEGINNING OF YEAR 64,237,728 64,638,290 2,218,960
CASH AND CASH EQUIVALENTS, END OF YEAR $ 64,638,290 $ 74,462,861 $ 2,556,226
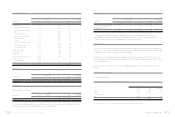
SUPPLEMENTAL CASH FLOW INFORMATION
Cash paid during the year
Interest $ 2,219 $ 2,386 $ 82
Income tax $ 3,057,172 $ 4,448,828 $ 152,723
NONCASH INVESTING AND FINANCING ACTIVITIES
Transfer of retained earnings to stock dividends for distribution $372,697 $ 386,968 $ 13,284
Transfer of assets leased to others to properties $ 261,824 $ 47,813 $ 1,641
Retirement of treasury stock $ 5,817,207 $ 4,834,174 $ 165,952
Transfer of stock bonuses to employees to common stock and
additional paid-in capital $ 4,954,889 $ 1,943,694 $ 66,725
Cost of properties and assets leased to others purchased $ 1,749,140 $ 5,278,345 $ 181,200
Decrease (increase) in payable for purchase of equipment 160,535 ( 288,425 ) ( 9,902 )
Decrease in lease payable 1,004 1,076 37
Cash paid for purchase of properties and assets leased to others $ 1,910,679 $ 4,990,996 $ 171,335
ACQUISITION OF A SUBSIDIARY
Increase in investments accounted for by the equity method $ - $ 245,927 $ 8,442
Decrease (increase) in other payable 26,262 ( 167,655 ) ( 5,755 )
Cash paid for acquisition of a subsidiary $26,262 $ 78,272 $ 2,687
The accompanying notes are an integral part of the financial statements. (Concluded)
(Continued)