HTC 2010 Annual Report Download - page 53
Download and view the complete annual report
Please find page 53 of the 2010 HTC annual report below. You can navigate through the pages in the report by either clicking on the pages listed below, or by using the keyword search tool below to find specific information within the annual report.-
 1
1 -
2
-
3
-
4
-
5
-
6
-
7
-
8
-
9
-
10
-
11
-
12
-
13
-
14
-
15
-
16
-
17
-
18
-
19
-
20
-
21
-
22
-
23
-
24
-
25
-
26
-
27
-
28
-
29
-
30
-
31
-
32
-
33
-
34
-
35
-
36
-
37
-
38
-
39
-
40
-
41
-
42
-
 43
43 -
 44
44 -
 45
45 -
 46
46 -
 47
47 -
 48
48 -
 49
49 -
 50
50 -
 51
51 -
 52
52 -
 53
53 -
 54
54 -
 55
55 -
 56
56 -
 57
57 -
 58
58 -
 59
59 -
 60
60 -
 61
61 -
 62
62 -
 63
63 -
64
-
65
-
66
-
67
-
68
-
69
-
70
-
71
-
72
-
73
-
74
-
75
-
76
-
77
-
78
-
79
-
80
-
81
-
82
-
83
-
84
-
85
-
86
-
87
-
88
-
89
-
90
-
91
-
92
-
93
-
94
-
95
-
96
-
97
-
98
-
99
-
100
-
101
 |
 |

104 2 0 1 0 H T C A N N U A L R E P O R T 105
FINANCIAL INFORMATION
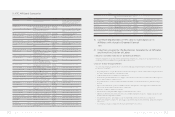
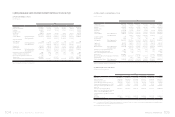
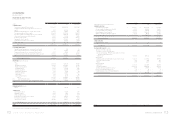
1. ABBREVIATED BALANCE SHEETS AND INCOME STATEMENTS FOR THE PAST FIVE FISCAL YEARS
(1) Abbreviated Balance Sheets
Unit: NT$ thousands
Year
Item 2010 2009 2008 2007 2006 As of 2011.3.31
Current Assets 156,908,107 101,503,673 101,271,990 83,172,719 61,810,772 183,880,137
Long-term Investments 10,708,420 6,506,194 5,160,891 2,899,109 824,481 14,701,217
Properties 10,941,230 8,314,177 7,375,651 3,715,901 2,909,624 11,239,179
Intangible Assets 208,581 - - - - 198,675
Other Assets 5,284,115 3,297,898 1,417,830 656,817 449,300 7,252,697
Total Assets 184,050,453 119,621,942 115,226,362 90,444,546 65,994,177 217,271,905
Current Liabilities Before Appropriation 109,335,331 53,980,282 54,558,470 34,368,139 23,421,319 127,441,341
After Appropriation *74,102,614 74,684,104 55,064,686 37,106,789 *
Long-term Liabilities - - - - - -
Other Liabilities 628 1,210 6,406 628 640 628
Total Liabilities Before Appropriation 109,335,959 53,981,492 54,564,876 34,368,767 23,421,959 127,441,969
After Appropriation *74,103,824 74,690,510 55,065,314 37,107,429 *
Capital stock 8,176,532 7,889,358 7,553,938 5,731,337 4,364,192 8,176,532
Capital surplus 10,820,744 9,099,923 4,417,534 4,415,845 4,452,688 10,820,744
Retained Earnings Before Appropriation 63,150,566 48,637,773 52,036,321 45,920,120 33,988,785 77,983,430
After Appropriation *28,128,473 31,537,990 23,400,972 18,899,930 *
Unrealized Loss On Financial Instruments (885) (1,658) (1,632) (1,187) (238) (284)
Cumulative Translation Adjustments (579,849) 15,088 65,602 9,664 10,786 (297,872)
Net Loss Not Recognized As Pension Cost (121) (34) - - - (121)
Treasury Stock (6,852,493) - (3,410,277) - (243,995) (6,852,493)
Total Stockholders’ Equity Before Appropriation 74,714,494 65,640,450 60,661,486 56,075,779 42,572,218 89,829,936
After Appropriation *45,518,118 40,535,852 35,379,232 28,886,748 *
*Subject to change after shareholders’ meeting resolution
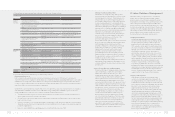
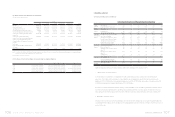
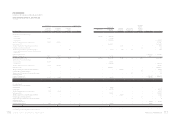
(2) Abbreviated Consolidated Balance Sheets
Unit: NT$ thousands
Year
Item 2010 2009 2008 2007 2006 As of 2011.3.31
Current Assets 168,639,526 104,900,881 104,256,700 85,763,011 62,812,623 194,463,432
Long-term Investments 1,232,145 810,485 541,437 501,976 2,925 2,719,422
Properties 14,024,329 9,899,808 8,916,350 4,220,962 3,170,398 14,596,809
Intangible Assets 935,650 240,482 289,783 175,206 - 2,332,737
Other Assets 5,550,094 3,577,361 1,738,140 755,326 477,478 7,566,238
Total Assets 190,381,744 119,429,017 115,742,410 91,416,481 66,463,424 221,678,638
Current Liabilities Before Appropriation 115,641,103 53,728,775 54,998,933 35,152,925 23,757,897 131,828,222
After Appropriation *73,851,107 75,124,567 55,849,472 37,443,367 *
Long-term Liabilities 12,188 24,375 46,875 75,625 - 4,063
Other Liabilities 13,959 1,210 6,420 633 640 16,417
Total Liabilities Before Appropriation 115,667,250 53,754,360 55,052,228 35,229,183 23,758,537 131,848,702
After Appropriation *73,876,692 75,177,862 55,925,730 37,444,007 *
Capital stock 8,176,532 7,889,358 7,553,938 5,731,337 4,364,192 8,176,532
Capital surplus 10,820,744 9,099,923 4,417,534 4,415,845 4,452,688 10,820,744
Retained Earnings Before Appropriation 63,150,566 48,637,773 52,036,321 45,920,120 33,988,785 77,983,430
After Appropriation *28,128,473 31,537,990 23,400,972 18,899,930 *
Unrealized Loss On Financial Instruments (885) (1,658) (1,632) (1,187) (238) (284)
Cumulative Translation Adjustments (579,849) 15,088 65,602 9,664 10,786 (297,872)
Net Loss Not Recognized As Pension Cost (121) (34) - - - (121)
Treasury Stock (6,852,493) - (3,410,277) - (243,995) (6,852,493)
Equity Attributable To The Stockholders Of The Parent 74,714,494 65,640,450 60,661,486 56,075,779 42,572,218 89,829,936
Minority Interest - 34,207 28,696 111,519 132,669 -
Total Stockholders’ Equity Before Appropriation 74,714,494 65,674,657 60,690,182 56,187,298 42,704,887 89,829,936
After Appropriation *45,552,325 40,564,548 35,490,751 29,019,417 *
*Subject to change after shareholders’ meeting resolution
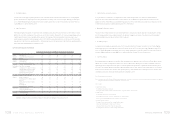
(3) Abbreviated Income Statements
Unit: NT$ thousands (Except EPS NT$)
Year
Item 2010 2009 2008 2007(Note 2) 2006(Note 2) 2011 1Q
Revenues 275,046,954 144,880,715 152,558,766 118,579,958 104,816,548 101,018,948
Gross Profit (Note 1) 79,556,972 45,862,483 50,641,854 40,177,500 31,322,998 27,420,007
Operating Income (Note 1) 42,295,343 24,174,994 30,256,385 30,535,537 25,820,624 15,284,442
Non-operating Income and Gains (Note 1) 2,536,080 1,623,362 2,300,018 1,810,908 1,234,336 1,528,358
Non-operating Expenses and Losses (Note 1) 340,114 585,892 965,924 195,148 97,082 145,415
Income from Continuing Operations before
Income Tax
44,491,309 25,212,464 31,590,479 32,151,297 26,957,878 16,667,385
Income from Continuing Operations 39,533,600 22,608,902 28,635,349 28,938,862 25,247,327 14,832,864
Income (Loss) from Discontinued Operations - - - - - -
Income (Loss) from Extraordinary Items - - - - - -
Cumulative Eect of Changes in Accounting
Principle
-- - - - -
Net Income 39,533,600 22,608,902 28,635,349 28,938,862 25,247,327 14,832,864
Basic Earnings Per Share 48.49 27.35 34.44 34.74 30.07 18.36
Note 1: In accordance with 2008 and 2010 financial reporting requirements, write-downs of inventories or reversal of write-downs and product warranty costs registered during the
period 2006 to 2007 have been reclassified as cost of revenues items.
Note 2: Excluded employee bonus expenses