HTC 2010 Annual Report Download - page 58
Download and view the complete annual report
Please find page 58 of the 2010 HTC annual report below. You can navigate through the pages in the report by either clicking on the pages listed below, or by using the keyword search tool below to find specific information within the annual report.-
 1
1 -
2
-
3
-
4
-
5
-
6
-
7
-
8
-
9
-
10
-
11
-
12
-
13
-
14
-
15
-
16
-
17
-
18
-
19
-
20
-
21
-
22
-
23
-
24
-
25
-
26
-
27
-
28
-
29
-
30
-
31
-
32
-
33
-
34
-
35
-
36
-
37
-
38
-
39
-
40
-
41
-
42
-
43
-
44
-
45
-
46
-
47
-
 48
48 -
 49
49 -
 50
50 -
 51
51 -
 52
52 -
 53
53 -
 54
54 -
 55
55 -
 56
56 -
 57
57 -
 58
58 -
 59
59 -
 60
60 -
 61
61 -
 62
62 -
 63
63 -
 64
64 -
 65
65 -
 66
66 -
 67
67 -
 68
68 -
69
-
70
-
71
-
72
-
73
-
74
-
75
-
76
-
77
-
78
-
79
-
80
-
81
-
82
-
83
-
84
-
85
-
86
-
87
-
88
-
89
-
90
-
91
-
92
-
93
-
94
-
95
-
96
-
97
-
98
-
99
-
100
-
101
 |
 |

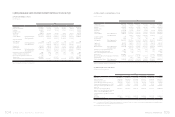
114 2 0 1 0 H T C A N N U A L R E P O R T 115
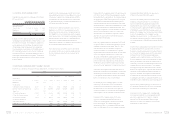
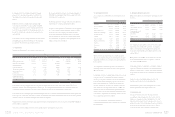
FINANCIAL INFORMATION
HTC CORPORATION
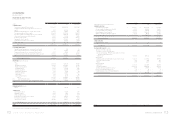
STATEMENTS OF INCOME
YEARS ENDED DECEMBER 31, 2009 AND 2010
(In Thousands, Except Earnings Per Share)
2009 2010
NT$ NT$ US$(Note3)
REVENUES (Notes 2 and 24) $ 144,880,715 $ 275,046,954 $ 9,442,051
COST OF REVENUES (Notes 9, 20 and 24) 99,018,232 195,489,982 6,710,950
GROSS PROFIT 45,862,483 79,556,972 2,731,101
UNREALIZED PROFIT FROM INTERCOMPANY TRANSACTIONS ( 108,150 ) ( 345,455 ) ( 11,859 )
REALIZED PROFIT FROM INTERCOMPANY TRANSACTIONS 134,091 108,150 3,713
REALIZED GROSS PROFIT 45,888,424 79,319,667 2,722,955
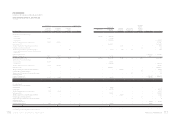
OPERATING EXPENSES (Notes 20 and 24)
Selling and marketing 11,103,061 19,516,895 669,993
General and administrative 2,010,000 4,812,579 165,211
Research and development 8,600,369 12,694,850 435,800
Total operating expenses 21,713,430 37,024,324 1,271,004
OPERATING INCOME 24,174,994 42,295,343 1,451,951
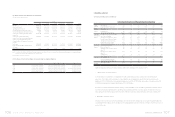
NONOPERATING INCOME AND GAINS
Interest income 348,693 286,610 9,839
Gains on equity-method investments (Notes 2 and 13) 273,811 1,457,395 50,031
Gain on disposal of properties 2,984 - -
Gains on sale of investments, net 3,035 3,001 103
Exchange gain (Note 2) 513,650 - -
Valuation gains on financial instruments, net(Notes 2 and 5) 18,132 450,276 15,457
Other (Note 24) 463,057 338,798 11,631
Total nonoperating income and gains 1,623,362 2,536,080 87,061
NONOPERATING EXPENSES AND LOSSES
Interest expense 131 46 2
Loss on disposal of properties -139 5
Exchange loss (Note 2) -303,549 10,420
Impairment losses (Notes 2, 12 and 13) 30,944 1,192 41
Other 554,817 35,188 1,208
Total nonoperating expenses and losses 585,892 340,114 11,676
INCOME BEFORE INCOME TAX 25,212,464 44,491,309 1,527,336
INCOME TAX (Notes 2 and 21) ( 2,603,562 ) ( 4,957,709 ) ( 170,193 )
NET INCOME $ 22,608,902 $ 39,533,600 $ 1,357,143
2009 2010
Related Party
Before Income
Tax
After Income
Tax
Before Income
Tax
After Income
Tax
NT$ NT$ NT$ US$ (Note 3) NT$ US$ (Note 3)
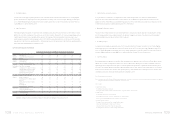
BASIC EARNINGS PER SHARE(Note 22) $ 30.50 $ 27.35 $ 54.57 $ 1.87 $ 48.49 $ 1.66
DILUTED EARNINGS PER SHARE (Note 22) $ 29.95 $ 26.86 $ 53.90 $ 1.85 $ 47.89 $ 1.64
The accompanying notes are an integral part of the financial statements. (Concluded)