HTC 2010 Annual Report Download - page 57
Download and view the complete annual report
Please find page 57 of the 2010 HTC annual report below. You can navigate through the pages in the report by either clicking on the pages listed below, or by using the keyword search tool below to find specific information within the annual report.
112 2 0 1 0 H T C A N N U A L R E P O R T 113
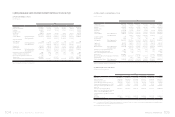
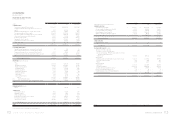
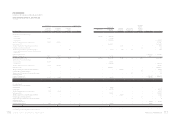
FINANCIAL INFORMATION
HTC CORPORATION
BALANCE SHEETS
DECEMBER 31, 2009 AND 2010
(In Thousands, Except Par Value)
2009 2010
ASSETS NT$ NT$ US$(Note3)
CURRENT ASSETS
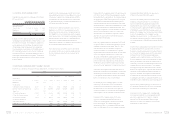
Cash and cash equivalents (Notes 2 and 4) $ 61,676,464 $ 66,282,076 $ 2,275,389
Financial assets at fair value through profit or loss (Notes 2, 5
and 23) 18,132 450,276 15,457
Available-for-sale financial assets - current (Notes 2 and 6) 2,497,394 441,948 15,172
Accounts receivable, net (Notes 2 and 7) 25,326,228 35,179,038 1,207,657
Accounts receivable from related parties, net (Notes 2 and 24) 2,244,550 28,186,391 967,607
Other current financial assets (Notes 8 and 24) 234,201 717,636 24,635
Inventories (Notes 2 and 9) 5,217,193 21,920,492 752,506
Prepayments (Notes 10 and 24) 3,351,491 2,347,617 80,591
Deferred income tax assets (Notes 2 and 21) 811,240 925,579 31,774
Other current assets 126,780 457,054 15,690
Total current assets 101,503,673 156,908,107 5,386,478
LONG-TERM INVESTMENTS
Available-for-sale financial assets - noncurrent (Notes 2 and 6) 313 538 18
Held-to-maturity financial assets - noncurrent (Notes 2 and 11) -207,946 7,139
Financial assets carried at cost - noncurrent (Notes 2 and 12) 501,192 515,861 17,709
Investments accounted for by the equity method (Notes 2 and 13) 5,549,766 9,900,410 339,870
Prepayments for long-term investments (Notes 2 and 13) 454,923 83,665 2,872
Total long-term investments
6,506,194 10,708,420 367,608
PROPERTIES
(Notes 2, 14 and 24)
Cost
Land 4,719,538 5,690,718 195,356
Buildings and structures 3,174,986 3,504,669 120,312
Machinery and equipment 4,008,111 5,564,902 191,037
Molding equipment 172,632 172,632 5,926
Computer equipment 302,213 343,939 11,807
Transportation equipment 2,732 6,242 214
Furniture and fixtures 129,533 147,349 5,058
Leased assets 4,712 4,712 162
Leasehold improvements 96,014 151,716 5,208
Total cost 12,610,471 15,586,879 535,080
Less: Accumulated depreciation ( 4,321,855 ) ( 4,934,160 ) ( 169,384 )
Prepayments for construction-in-progress and equipment-in-transit 25,561 288,511 9,904
Properties, net 8,314,177 10,941,230 375,600
INTANGIBLE ASSETS (Note 2)
Patents -208,581 7,160
OTHER ASSETS
Assets leased to others 48,135 50,828 1,745
Refundable deposits 69,166 79,197 2,719
Deferred charges (Note 2) 69,773 27,658 949
Deferred income tax assets (Notes 2 and 21) 1,066,101 2,419,431 83,056
Restricted assets (Note 25) 63,900 63,900 2,194
Other (Notes 2, 10 and 17) 1,980,823 2,643,101 90,735
Total other assets 3,297,898 5,284,115 181,398
TOTAL $ 119,621,942 $ 184,050,453 $ 6,318,244
The accompanying notes are an integral part of the financial statements.
2009 2010
LIABILITIES AND STOCKHOLDERS’ EQUITY NT$ NT$ US$(Note3)
CURRENT LIABILITIES
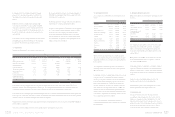
Notes and accounts payable $ 25,275,140 $ 58,420,924 $ 2,005,524
Accounts payable to related parties (Note 24) 85,676 1,346,981 46,240
Income tax payable (Notes 2 and 21) 4,152,624 6,416,667 220,277
Accrued expenses (Notes 15 and 24) 17,127,974 31,663,629 1,086,977
Payable for purchase of equipment (Note 24) 68,906 318,587 10,937
Other current liabilities (Notes 16 and 24) 7,269,962 11,168,543 383,403
Total current liabilities 53,980,282 109,335,331 3,753,358
OTHER LIABILITIES
Guarantee deposits received 1,210 628 22
Total liabilities 53,981,492 109,335,959 3,753,380
STOCKHOLDERS’ EQUITY (Note 18)
Capital stock - NT$10.00 par value
Authorized: 1,000,000 thousand shares
Issued and outstanding: 788,936 thousand shares in 2009 and
817,653 thousand shares in 2010
Common stock 7,889,358 8,176,532 280,691
Capital surplus
Additional paid-in capital from share issuance in excess of par 9,056,323 10,777,623 369,984
Long-term equity investments 18,411 18,411 632
Merger 25,189 24,710 848
Retained earnings
Legal reserve 10,273,674 10,273,674 352,684
Accumulated earnings 38,364,099 52,876,892 1,815,204
Cumulative translation adjustments (Note 2) 15,088 ( 579,849 ) ( 19,906
Net loss not recognized as pension cost ( 34 ) ( 121 ) ( 4 )
Unrealized valuation losses on financial instruments ( 1,658 ) ( 885 ) ( 30 )
Treasury stock (Notes 2 and 19) -( 6,852,493 ) ( 235,239 )
Total stockholders’ equity 65,640,450 74,714,494 2,564,864
TOTAL $ 119,621,942 $ 184,050,453 $ 6,318,244


