Google 2010 Annual Report Download - page 93
Download and view the complete annual report
Please find page 93 of the 2010 Google annual report below. You can navigate through the pages in the report by either clicking on the pages listed below, or by using the keyword search tool below to find specific information within the annual report.
months ended September 30, 2010. The IRS commenced its examination of our 2007 and 2008 tax years in early
2010. We do not expect the examination to be completed within the next 12 months. Therefore, we do not
anticipate any significant impact to our unrecognized tax benefit balance in 2011, related to our 2007 and 2008
tax years.
Our 2009 and 2010 tax years remain subject to examination by the IRS for U.S. federal tax purposes, and our
2003 through 2010 tax years remain subject to examination by the appropriate governmental agencies for Irish
tax purposes. There are various other ongoing audits in various other jurisdictions that are not material to our
financial statements.
Note 16. Information about Geographic Areas
Our chief operating decision-makers (i.e., chief executive officer, certain of his direct reports, and our
founders) review financial information presented on a consolidated basis, accompanied by disaggregated
information about revenues by geographic region for purposes of allocating resources and evaluating financial
performance. There are no segment managers who are held accountable by our chief operating decision-makers,
or anyone else, for operations, operating results, and planning for levels or components below the consolidated unit
level. Accordingly, we consider ourselves to be in a single reporting segment and operating unit structure.
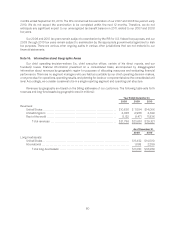
Revenues by geography are based on the billing addresses of our customers. The following table sets forth
revenues and long-lived assets by geographic area (in millions):
Year Ended December 31,
2008 2009 2010
Revenues:
United States ........................................................ $10,636 $ 11,194 $14,056
United Kingdom ..................................................... 3,038 2,986 3,329
Rest of the world ..................................................... 8,122 9,471 11,936
Total revenues .................................................. $21,796 $23,651 $ 29,321
As of December 31,
2009 2010
Long-lived assets:
United States .................................................................. $9,432 $14,000
International ................................................................... 1,898 2,289
Total long-lived assets ..................................................... $11,330 $16,289
80


