Google 2010 Annual Report Download - page 80
Download and view the complete annual report
Please find page 80 of the 2010 Google annual report below. You can navigate through the pages in the report by either clicking on the pages listed below, or by using the keyword search tool below to find specific information within the annual report.-
 1
1 -
2
-
3
-
4
-
5
-
6
-
7
-
8
-
9
-
10
-
11
-
12
-
13
-
14
-
15
-
16
-
17
-
18
-
19
-
20
-
21
-
22
-
23
-
24
-
25
-
26
-
27
-
28
-
29
-
30
-
31
-
32
-
33
-
34
-
35
-
36
-
37
-
38
-
39
-
40
-
41
-
42
-
43
-
44
-
45
-
46
-
47
-
48
-
49
-
50
-
51
-
52
-
53
-
54
-
55
-
56
-
57
-
58
-
59
-
60
-
61
-
62
-
63
-
64
-
65
-
66
-
67
-
68
-
69
-
 70
70 -
 71
71 -
 72
72 -
 73
73 -
 74
74 -
 75
75 -
 76
76 -
 77
77 -
 78
78 -
 79
79 -
 80
80 -
 81
81 -
 82
82 -
 83
83 -
 84
84 -
 85
85 -
 86
86 -
 87
87 -
 88
88 -
 89
89 -
 90
90 -
91
-
92
-
93
-
94
-
95
-
96
-
97
-
98
-
99
-
100
-
101
-
102
-
103
-
104
-
105
-
106
-
107
 |
 |

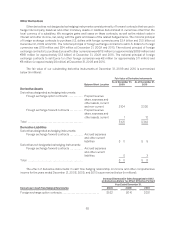
The fair value hierarchy also requires an entity to maximize the use of observable inputs and minimize the use
of unobservable inputs when measuring fair value.
We classify our cash equivalents and marketable securities within Level 1 or Level 2. This is because we value
our cash equivalents and marketable securities using quoted market prices or alternative pricing sources and
models utilizing market observable inputs. We classify our foreign currency derivative contracts within Level 2 as
the valuation inputs are based on quoted prices and market observable data of similar instruments. We classify our
investments in ARS within Level 3 because they are valued using valuation techniques (see Note 3). Some of the
inputs to these models are unobservable in the market and are significant.
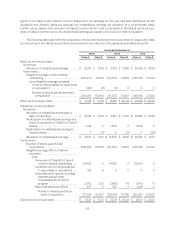
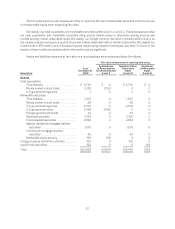
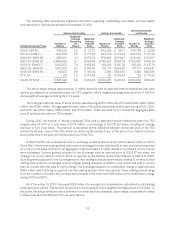
Assets and liabilities measured at fair value on a recurring basis are summarized below (in millions):
Description
As of
December 31,
2009
Fair value measurement at reporting date using
Quoted Prices
in Active Markets
for Identical Assets
(Level 1)
Significant Other
Observable
Inputs
(Level 2)
Significant
Unobservable
Inputs
(Level 3)
Assets
Cash equivalents:
Time deposits ........................ $ 3,740 $ 0 $ 3,740 $ 0
Money market mutual funds ............ 2,153 2,153 0 0
U.S. government agencies ............. 2 0 2 0
Marketable securities:
Time deposits ........................ 1,250 0 1,250 0
Money market mutual funds . . . . . . . . . . . . 28 0 28 0
U.S. government agencies ............. 3,703 0 3,703 0
U.S. government notes ................ 2,492 2,492 0 0
Foreign government bonds . . . . . . . . . . . . . 37 0 37 0
Municipal securities ................... 2,130 0 2,130 0
Corporate debt securities .............. 2,822 0 2,822 0
Agency residential mortgage-backed
securities .......................... 1,578 0 1,578 0
Commercial mortgage-backed
securities .......................... 48 0 48 0
Marketable equity security . . . . . . . . . . . . . 199 199 0 0
Foreign currency derivative contracts . . . . . . . . 105 0 105 0
Auction rate securities . . . . . . . . . . . . . . . . . . . . . 182 0 0 182
Total ..................................... $20,469 $4,844 $15,443 $182
67