Google 2010 Annual Report Download - page 44
Download and view the complete annual report
Please find page 44 of the 2010 Google annual report below. You can navigate through the pages in the report by either clicking on the pages listed below, or by using the keyword search tool below to find specific information within the annual report.-
 1
1 -
2
-
3
-
4
-
5
-
6
-
7
-
8
-
9
-
10
-
11
-
12
-
13
-
14
-
15
-
16
-
17
-
18
-
19
-
20
-
21
-
22
-
23
-
24
-
25
-
26
-
27
-
28
-
29
-
30
-
31
-
32
-
33
-
 34
34 -
 35
35 -
 36
36 -
 37
37 -
 38
38 -
 39
39 -
 40
40 -
 41
41 -
 42
42 -
 43
43 -
 44
44 -
 45
45 -
 46
46 -
 47
47 -
 48
48 -
 49
49 -
 50
50 -
 51
51 -
 52
52 -
 53
53 -
 54
54 -
55
-
56
-
57
-
58
-
59
-
60
-
61
-
62
-
63
-
64
-
65
-
66
-
67
-
68
-
69
-
70
-
71
-
72
-
73
-
74
-
75
-
76
-
77
-
78
-
79
-
80
-
81
-
82
-
83
-
84
-
85
-
86
-
87
-
88
-
89
-
90
-
91
-
92
-
93
-
94
-
95
-
96
-
97
-
98
-
99
-
100
-
101
-
102
-
103
-
104
-
105
-
106
-
107
 |
 |

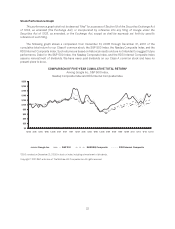
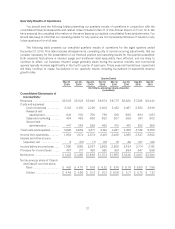
results and the advertisements displayed, which we believe results in a better user experience, which in turn results
in more searches, advertisers, and Google Network members and other partners.
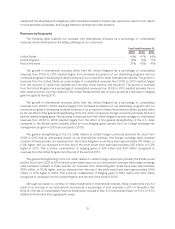
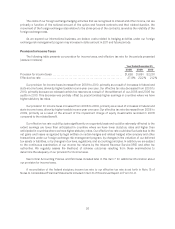
Revenues by Geography
The following table presents our domestic and international revenues as a percentage of consolidated
revenues, determined based on the billing addresses of our customers:
Year Ended December 31,
2008 2009 2010
UnitedStates ................................................................... 49% 47% 48%
UnitedKingdom ................................................................. 14% 13% 11%
Restoftheworld ................................................................ 37% 40% 41%
The growth in international revenues (other than the United Kingdom) as a percentage of consolidated
revenues from 2009 to 2010 resulted largely from increased acceptance of our advertising programs and our
continued progress in developing localized versions of our products for these international markets. The growth in
revenues from the United States as a percentage of consolidated revenues from 2009 to 2010 resulted largely
from the recovery of certain key verticals such as retail, travel, finance, and insurance. The decline in revenues
from the United Kingdom as a percentage of consolidated revenues from 2009 to 2010 resulted primarily from a
less robust economic recovery relative to the United States and the rest of world, as well as a decrease in hedging
gains recognized during 2010.
The growth in international revenues (other than the United Kingdom) as a percentage of consolidated
revenues from 2008 to 2009 resulted largely from increased acceptance of our advertising programs and our
continued progress in developing localized versions of our products for these international markets, partially offset
by the net effect of the general strengthening of the U.S. dollar compared to foreign currencies (primarily the Euro)
and the related hedging gains. The decrease in revenues from the United Kingdom as a percentage of consolidated
revenues from 2008 to 2009 resulted largely from the effect of the general strengthening of the U.S. dollar
compared to the British pound, partially offset by more hedging gains realized from our foreign exchange risk
management program in 2009 as compared to 2008.
The general strengthening of the U.S. dollar relative to certain foreign currencies (primarily the Euro) from
2009 to 2010 had an unfavorable impact on our international revenues. Had foreign exchange rates remained
constant in these periods, our revenues from the United Kingdom would have been approximately $10 million, or
0.3% higher, and our revenues from the rest of the world would have been approximately $25 million, or 0.2%
higher in 2010. This is before consideration of hedging gains of $42 million and $161 million recognized to
revenues from the United Kingdom and the rest of the world in 2010.
The general strengthening of the U.S. dollar relative to certain foreign currencies (primarily the British pound
and the Euro) from 2008 to 2009 had an unfavorable impact on our international revenues. Had foreign exchange
rates remained constant in these periods, our revenues from United Kingdom would have been approximately
$543 million, or 18.2% higher, and our revenues from the rest of the world would have been approximately $484
million, or 5.1% higher in 2009. This is before consideration of hedging gains of $182 million and $143 million
recognized to revenues from the United Kingdom and the rest of the world in 2009.
Although we expect to continue to make investments in international markets, these investments may not
result in an increase in our international revenues as a percentage of total revenues in 2011 or thereafter. See
Note 16 of Notes to Consolidated Financial Statements included in Item 8 of this Annual Report on Form 10-K for
additional information about geographic areas.
31