Google 2010 Annual Report Download - page 68
Download and view the complete annual report
Please find page 68 of the 2010 Google annual report below. You can navigate through the pages in the report by either clicking on the pages listed below, or by using the keyword search tool below to find specific information within the annual report.otherwise direct search queries to our website (collectively referred to as distribution arrangements). These
amounts are primarily based on the revenue share arrangements with our Google Network members and
distribution partners.
Certain distribution arrangements require us to pay our distribution partners based on a fee per access point
delivered and not exclusively—or at all—based on revenue share. These fees are non-refundable. Further, these
distribution arrangements are terminable at will, although under the terms of certain contracts we or our
distribution partners may be subject to penalties in the event of early termination. We recognize fees under these
distribution arrangements over the estimated useful lives of the access points (approximately two years) to the
extent we can reasonably estimate those lives and they are longer than one year, or based on any contractual
revenue share, if greater. Otherwise, the fees are charged to expense as incurred. The estimated useful life of the
access points is based on the historical average period of time they generate traffic and revenues. Further, we
review the access points for impairment by distribution partner, type, and geography, and we have not made any
impairment to date.
Prepaid revenue share and distribution fees are included in prepaid revenue share, expenses, and other assets
on the accompanying Consolidated Balance Sheets.
Cost of revenues also includes the expenses associated with the operation of our data centers, including
depreciation, labor, energy, bandwidth costs, credit card and other transaction fees related to processing customer
transactions including Google Checkout transactions, amortization of acquired intangible assets, as well as
content acquisition costs. We have entered into arrangements with certain content providers under which we
distribute or license their video and other content. In a number of these arrangements, we display ads on the pages
of our websites and our Google Network members’ websites from which the content is viewed and share most of
the fees these ads generate with the content providers and the Google Network members.
Stock-based Compensation
We have elected to use the BSM option pricing model to determine the fair value of stock options on the dates
of grant.Restricted stock units (RSUs) are measured based on the fair market values of the underlying stock on
the dates of grant. Shares are issued on the vesting dates net of the statutory withholding requirements to be paid
by us on behalf of our employees. As a result, the actual number of shares issued will be fewer than the actual
number of RSUs outstanding. Furthermore, we record the liability for withholding amounts to be paid by us as a
reduction to additional paid-in capital when paid. Also, we recognize stock-based compensation using the straight-
line method.
We include as part of cash flows from financing activities the benefits of tax deductions in excess of the
tax-effected compensation of the related stock-based awards for options exercised and RSUs vested during the
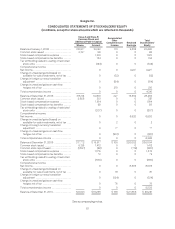
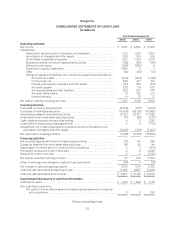
period. During the years ended December 31, 2008, 2009, and 2010, the amount of cash received from the
exercise of stock options was $73 million, $350 million, and $656 million, and the total direct tax benefit realized,
including the excess tax benefit, from stock-based award activities was $251 million, $260 million, and $355
million. We have elected to account for the indirect effects of stock-based awards—primarily the research and
development tax credit—through the Consolidated Statements of Income.
In the years ended December 31, 2008, 2009, and 2010 we recognized stock-based compensation and
related tax benefits of $1,120 million and $232 million, $1,164 million and $264 million, and $1,376 million and $314
million.
Certain Risks and Concentrations
Our revenues are principally derived from online advertising, the market for which is highly competitive and
rapidly changing. In addition, our revenues are generated from a multitude of vertical market segments in countries
around the world. Significant changes in this industry or changes in customer buying or advertiser spending
behavior could adversely affect our operating results.
55


