Google 2010 Annual Report Download - page 50
Download and view the complete annual report
Please find page 50 of the 2010 Google annual report below. You can navigate through the pages in the report by either clicking on the pages listed below, or by using the keyword search tool below to find specific information within the annual report.-
 1
1 -
2
-
3
-
4
-
5
-
6
-
7
-
8
-
9
-
10
-
11
-
12
-
13
-
14
-
15
-
16
-
17
-
18
-
19
-
20
-
21
-
22
-
23
-
24
-
25
-
26
-
27
-
28
-
29
-
30
-
31
-
32
-
33
-
34
-
35
-
36
-
37
-
38
-
39
-
 40
40 -
 41
41 -
 42
42 -
 43
43 -
 44
44 -
 45
45 -
 46
46 -
 47
47 -
 48
48 -
 49
49 -
 50
50 -
 51
51 -
 52
52 -
 53
53 -
 54
54 -
 55
55 -
 56
56 -
 57
57 -
 58
58 -
 59
59 -
 60
60 -
61
-
62
-
63
-
64
-
65
-
66
-
67
-
68
-
69
-
70
-
71
-
72
-
73
-
74
-
75
-
76
-
77
-
78
-
79
-
80
-
81
-
82
-
83
-
84
-
85
-
86
-
87
-
88
-
89
-
90
-
91
-
92
-
93
-
94
-
95
-
96
-
97
-
98
-
99
-
100
-
101
-
102
-
103
-
104
-
105
-
106
-
107
 |
 |

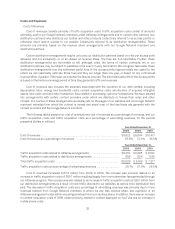
Quarterly Results of Operations
You should read the following tables presenting our quarterly results of operations in conjunction with the
consolidated financial statements and related notes included in Item 8 of this Annual Report on Form 10-K. We
have prepared the unaudited information on the same basis as our audited consolidated financial statements. You
should also keep in mind that our operating results for any quarter are not necessarily indicative of results for any
future quarters or for a full year.
The following table presents our unaudited quarterly results of operations for the eight quarters ended
December 31, 2010. This table includes all adjustments, consisting only of normal recurring adjustments, that we
consider necessary for fair presentation of our financial position and operating results for the quarters presented.
Both seasonal fluctuations in internet usage and traditional retail seasonality have affected, and are likely to
continue to affect, our business. Internet usage generally slows during the summer months, and commercial
queries typically increase significantly in the fourth quarter of each year. These seasonal trends have caused and
will likely continue to cause, fluctuations in our quarterly results, including fluctuations in sequential revenue
growth rates.
Quarter Ended
Mar 31,
2009 Jun 30,
2009 Sep 30,
2009 Dec 31,
2009 Mar 31,
2010 Jun 30,
2010 Sep 30,
2010 Dec 31,
2010
(in millions, except per share amounts)
(unaudited)
Consolidated Statements of
Income Data:
Revenues .................... $5,509 $5,523 $5,945 $6,674 $ 6,775 $6,820 $7,286 $8,440
Costs and expenses:
Cost of revenues .......... 2,102 2,108 2,226 2,408 2,452 2,467 2,552 2,946
Research and
development . . . . . . . . . . . 642 708 758 736 818 898 994 1,051
Sales and marketing . . . . . . 434 469 498 583 607 629 661 902
General and
administrative . . . . . . . . . . 447 364 389 466 410 461 532 559
Total costs and expenses ....... 3,625 3,649 3,871 4,193 4,287 4,455 4,739 5,458
Income from operations ........ 1,884 1,874 2,074 2,481 2,488 2,365 2,547 2,982
Interest and other income
(expense), net .............. 6 (18) (7) 88 18 69 167 160
Income before income taxes .... 1,890 1,856 2,067 2,569 2,506 2,434 2,714 3,142
Provision for income taxes . . . . . 467 371 428 595 551 594 547 599
Net income ................... $1,423 $ 1,485 $ 1,639 $ 1,974 $ 1,955 $ 1,840 $ 2,167 $ 2,543
Net income per share of Class A
and Class B common stock:
Basic .................... $ 4.51 $ 4.70 $ 5.18 $ 6.22 $ 6.15 $ 5.78 $ 6.80 $ 7.95
Diluted .................. $ 4.49 $ 4.66 $ 5.13 $ 6.13 $ 6.06 $ 5.71 $ 6.72 $ 7.81
37