Google 2010 Annual Report Download - page 42
Download and view the complete annual report
Please find page 42 of the 2010 Google annual report below. You can navigate through the pages in the report by either clicking on the pages listed below, or by using the keyword search tool below to find specific information within the annual report.-
 1
1 -
2
-
3
-
4
-
5
-
6
-
7
-
8
-
9
-
10
-
11
-
12
-
13
-
14
-
15
-
16
-
17
-
18
-
19
-
20
-
21
-
22
-
23
-
24
-
25
-
26
-
27
-
28
-
29
-
30
-
31
-
 32
32 -
 33
33 -
 34
34 -
 35
35 -
 36
36 -
 37
37 -
 38
38 -
 39
39 -
 40
40 -
 41
41 -
 42
42 -
 43
43 -
 44
44 -
 45
45 -
 46
46 -
 47
47 -
 48
48 -
 49
49 -
 50
50 -
 51
51 -
 52
52 -
53
-
54
-
55
-
56
-
57
-
58
-
59
-
60
-
61
-
62
-
63
-
64
-
65
-
66
-
67
-
68
-
69
-
70
-
71
-
72
-
73
-
74
-
75
-
76
-
77
-
78
-
79
-
80
-
81
-
82
-
83
-
84
-
85
-
86
-
87
-
88
-
89
-
90
-
91
-
92
-
93
-
94
-
95
-
96
-
97
-
98
-
99
-
100
-
101
-
102
-
103
-
104
-
105
-
106
-
107
 |
 |

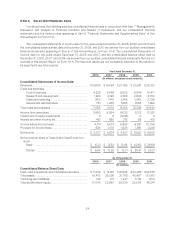
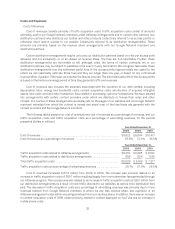
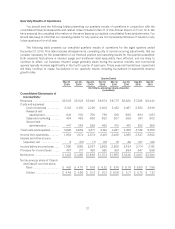
Results of Operations
The following table presents our historical operating results as a percentage of revenues for the periods
indicated:
Year Ended December 31,
2008 2009 2010
Consolidated Statements of Income Data:
Revenues ...................................................................... 100.0% 100.0% 100.0%
Costs and expenses:
Cost of revenues ........................................................... 39.6 37.4 35.5
Research and development .................................................. 12.8 12.0 12.8
Salesandmarketing ........................................................ 8.9 8.4 9.5
Generalandadministrative................................................... 8.3 7.0 6.8
Total costs and expenses ........................................................ 69.6 64.8 64.6
Income from operations .......................................................... 30.4 35.2 35.4
Impairment of equity investments ................................................. (5.0) 0 0
Interestandotherincome,net .................................................... 1.5 0.3 1.4
Income before income taxes ...................................................... 26.9 35.5 36.8
Provisionforincometaxes ....................................................... 7.5 7.9 7.8
Net income ..................................................................... 19.4% 27.6% 29.0%
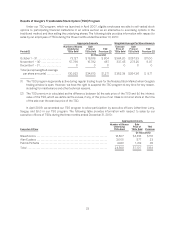
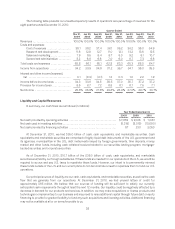
Revenues
The following table presents our revenues, by revenue source, for the periods presented (in millions):
Year Ended December 31,
2008 2009 2010
Advertising revenues:
Google websites .................................................... $14,414 $ 15,723 $ 19,444
Google Network websites ............................................ 6,715 7,166 8,792
Total advertising revenues ................................................ 21,129 22,889 28,236
Otherrevenues .......................................................... 667 762 1,085
Revenues ............................................................... $21,796 $ 23,651 $ 29,321
The following table presents our revenues, by revenue source, as a percentage of total revenues for the
periods presented:
Year Ended December 31,
2008 2009 2010
Advertising revenues:
Googlewebsites ............................................................ 66% 67% 66%
GoogleNetworkwebsites .................................................... 31 30 30
Totaladvertisingrevenues ............................................... 97 97 96
Google websites as % of advertising revenues . . . . . . . . . . . . . . . . . . . . . . . . . 68 69 69
Google Network websites as % of advertising revenues . . . . . . . . . . . . . . . . . 32 31 31
Otherrevenues.................................................................. 3% 3% 4%
The increase in our revenues from 2009 to 2010 resulted primarily from an increase in advertising revenues
generated by Google websites and Google Network members’ websites and, to a lesser extent, an increase in other
29