Google 2010 Annual Report Download - page 75
Download and view the complete annual report
Please find page 75 of the 2010 Google annual report below. You can navigate through the pages in the report by either clicking on the pages listed below, or by using the keyword search tool below to find specific information within the annual report.-
 1
1 -
2
-
3
-
4
-
5
-
6
-
7
-
8
-
9
-
10
-
11
-
12
-
13
-
14
-
15
-
16
-
17
-
18
-
19
-
20
-
21
-
22
-
23
-
24
-
25
-
26
-
27
-
28
-
29
-
30
-
31
-
32
-
33
-
34
-
35
-
36
-
37
-
38
-
39
-
40
-
41
-
42
-
43
-
44
-
45
-
46
-
47
-
48
-
49
-
50
-
51
-
52
-
53
-
54
-
55
-
56
-
57
-
58
-
59
-
60
-
61
-
62
-
63
-
64
-
 65
65 -
 66
66 -
 67
67 -
 68
68 -
 69
69 -
 70
70 -
 71
71 -
 72
72 -
 73
73 -
 74
74 -
 75
75 -
 76
76 -
 77
77 -
 78
78 -
 79
79 -
 80
80 -
 81
81 -
 82
82 -
 83
83 -
 84
84 -
 85
85 -
86
-
87
-
88
-
89
-
90
-
91
-
92
-
93
-
94
-
95
-
96
-
97
-
98
-
99
-
100
-
101
-
102
-
103
-
104
-
105
-
106
-
107
 |
 |

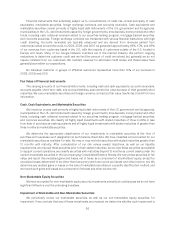
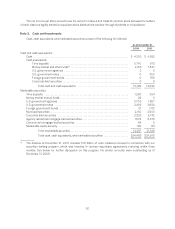
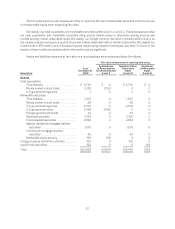
The following table summarizes the estimated fair value of our investments in marketable securities,
excluding the marketable equity security, designated as available-for-sale and classified by the contractual
maturity date of the security (in millions):
As of
December 31,
2010
Due in 1 year ............................................................................. $ 1,452
Due in 1 year through 5 years ............................................................... 6,836
Due in 5 years through 10 years ............................................................ 5,174
Due after 10 years ........................................................................ 7,722
Total ................................................................................ $21,184
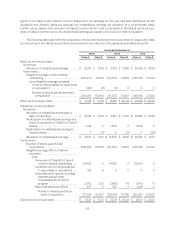
The following tables present gross unrealized losses and fair values for those investments that were in an
unrealized loss position as of December 31, 2009 and 2010, aggregated by investment category and the length of
time that individual securities have been in a continuous loss position (in millions):
As of December 31, 2009
Less than 12 Months
Security Description Fair Value Unrealized
Loss
U.S. government agencies ........................................................ $ 1,273 $ (2)
U.S. government notes ........................................................... 2,492 (28)
Corporate debt securities ......................................................... 1,175 (17)
Agency mortgage-backed securities ............................................... 1,040 (12)
Total ....................................................................... $5,980 $(59)
As of December 31, 2010
Less than 12 Months
Security Description Fair Value Unrealized
Loss
U.S.governmentagencies......................................................... $ 831 $ (8)
U.S. government notes ............................................................ 2,225 (50)
Foreigngovernmentbonds ........................................................ 129 (5)
Municipalsecurities .............................................................. 962 (5)
Corporate debt securities ......................................................... 1,061 (25)
Agency mortgage-backed securities ................................................ 1,675 (32)
Total ....................................................................... $6,883 $(125)
As of December 31, 2009 and 2010, we did not have any investments in marketable securities that were in an
unrealized loss position for 12 months or greater.
Auction Rate Securities
At December 31, 2010, we held $153 million of auction rate securities (ARS). The assets underlying these 29
individual investments are primarily student loans which are mostly AAA rated and substantially guaranteed by the
U.S. government under the Federal Family Education Loan Program. Historically, these securities have provided
liquidity through a Dutch auction process that resets the applicable interest rate at pre-determined intervals every
7 to 49 days. However, these auctions began to fail in the first quarter of 2008. Since these auctions have failed,
we have realized higher interest rates for many of these ARS than we would have otherwise. Although we have
62