Google 2010 Annual Report Download - page 53
Download and view the complete annual report
Please find page 53 of the 2010 Google annual report below. You can navigate through the pages in the report by either clicking on the pages listed below, or by using the keyword search tool below to find specific information within the annual report.-
 1
1 -
2
-
3
-
4
-
5
-
6
-
7
-
8
-
9
-
10
-
11
-
12
-
13
-
14
-
15
-
16
-
17
-
18
-
19
-
20
-
21
-
22
-
23
-
24
-
25
-
26
-
27
-
28
-
29
-
30
-
31
-
32
-
33
-
34
-
35
-
36
-
37
-
38
-
39
-
40
-
41
-
42
-
 43
43 -
 44
44 -
 45
45 -
 46
46 -
 47
47 -
 48
48 -
 49
49 -
 50
50 -
 51
51 -
 52
52 -
 53
53 -
 54
54 -
 55
55 -
 56
56 -
 57
57 -
 58
58 -
 59
59 -
 60
60 -
 61
61 -
 62
62 -
 63
63 -
64
-
65
-
66
-
67
-
68
-
69
-
70
-
71
-
72
-
73
-
74
-
75
-
76
-
77
-
78
-
79
-
80
-
81
-
82
-
83
-
84
-
85
-
86
-
87
-
88
-
89
-
90
-
91
-
92
-
93
-
94
-
95
-
96
-
97
-
98
-
99
-
100
-
101
-
102
-
103
-
104
-
105
-
106
-
107
 |
 |
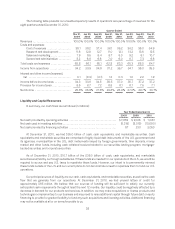
Cash provided by operating activities in 2008 was $7,853 million, and consisted of net income of $4,227
million, adjustments for non-cash items of $3,299 million, and cash provided by working capital and other
activities of $327 million. Adjustments for non-cash items primarily consisted of $1,212 million of depreciation and
amortization expense on property and equipment, $1,120 million of stock-based compensation expense, and
$1,095 million of impairment charges of equity investments, partially offset by $225 million of deferred income
taxes on earnings, and $159 million of excess tax benefits from stock-based award activities. In addition, changes
in working capital activities primarily consisted of a net increase in income taxes payable and deferred income
taxes of $626 million, which includes the same $159 million of excess tax benefits from stock-based award
activities included under adjustments for non-cash items, and an increase in accrued expenses and other liabilities
of $339 million. The increases in accrued expenses are a direct result of the growth of our business and an
increase in headcount. These increases to working capital activities were partially offset by an increase of $334
million in accounts receivable due to the growth in fees billed to our advertisers, a decrease of $212 million in
accounts payable due to the timing of invoice processing and payments and an increase of $147 million in prepaid
revenue shares, expenses, and other assets.
As we expand our business internationally, we have offered payment terms to certain advertisers that are
standard in their locales but longer than terms we would generally offer to our domestic advertisers. This may
increase our working capital requirements and may have a negative effect on cash provided by our operating
activities.
Cash used in investing activities in 2010 of $10,680 million was primarily attributable to net purchases of
marketable securities of $6,886 million, capital expenditures of $4,018 million of which $1.8 billion was for the
purchase of an office building in New York City in December 2010, and remaining amounts related principally to
our data centers and related equipment, and cash consideration used in acquisitions and other investments of
$1,067 million. Also, in connection with our securities lending program, we received $2,361 million of cash
collateral which was invested in reverse repurchase agreements. Of the $2,361 million, $1,611 million was classified
as cash and cash equivalents, and $750 million was classified as receivable under reverse repurchase agreements
on the accompanying Consolidated Balance Sheet. See Note 3 of Notes to Consolidated Financial Statements
included in Item 8 of this Annual Report on Form 10-K for further information about our securities lending
program.
Cash used in investing activities in 2009 of $8,019 million was primarily attributable to net purchases of
marketable securities of $7,036 million and capital expenditures of $810 million.
Cash used in investing activities in 2008 of $5,319 million was primarily attributable to cash consideration
used in acquisitions and other investments of $3,367 million primarily related to the acquisition of DoubleClick and
capital expenditures of $2,359 million, partially offset by net maturities and sales of marketable securities of $407
million including our investment in Clearwire.
In order to manage expected increases in internet traffic, advertising transactions, and new products and
services, and to support our overall global business expansion, we expect to make significant investments in our
systems, data centers, corporate facilities, information technology infrastructure, and employees in 2011 and
thereafter. However, the amount of our capital expenditures has fluctuated and may continue to fluctuate on a
quarterly basis.
In addition, we expect to spend a significant amount of cash on acquisitions and other investments from time
to time. These acquisitions generally enhance the breadth and depth of our expertise in engineering and other
functional areas, our technologies, and our product offerings.
Cash provided by financing activities in 2010 of $3,050 million was primarily driven by $3,463 million of net
cash proceeds from the issuance of commercial paper and a promissory note. This was partially offset by $801
40