Google 2010 Annual Report Download - page 48
Download and view the complete annual report
Please find page 48 of the 2010 Google annual report below. You can navigate through the pages in the report by either clicking on the pages listed below, or by using the keyword search tool below to find specific information within the annual report.-
 1
1 -
2
-
3
-
4
-
5
-
6
-
7
-
8
-
9
-
10
-
11
-
12
-
13
-
14
-
15
-
16
-
17
-
18
-
19
-
20
-
21
-
22
-
23
-
24
-
25
-
26
-
27
-
28
-
29
-
30
-
31
-
32
-
33
-
34
-
35
-
36
-
37
-
 38
38 -
 39
39 -
 40
40 -
 41
41 -
 42
42 -
 43
43 -
 44
44 -
 45
45 -
 46
46 -
 47
47 -
 48
48 -
 49
49 -
 50
50 -
 51
51 -
 52
52 -
 53
53 -
 54
54 -
 55
55 -
 56
56 -
 57
57 -
 58
58 -
59
-
60
-
61
-
62
-
63
-
64
-
65
-
66
-
67
-
68
-
69
-
70
-
71
-
72
-
73
-
74
-
75
-
76
-
77
-
78
-
79
-
80
-
81
-
82
-
83
-
84
-
85
-
86
-
87
-
88
-
89
-
90
-
91
-
92
-
93
-
94
-
95
-
96
-
97
-
98
-
99
-
100
-
101
-
102
-
103
-
104
-
105
-
106
-
107
 |
 |

General and administrative expenses decreased $135 million from 2008 to 2009. This decrease was
primarily related to the settlement agreement with the Authors Guild and the Association of American Publishers
(AAP) under which we recognized $95 million of expense in 2008. In addition, consulting costs decreased by $60
million.
As we expand our business and incur additional expenses, we expect general and administrative expenses will
increase in dollar amount and may increase as a percentage of revenues in 2011 and future periods.
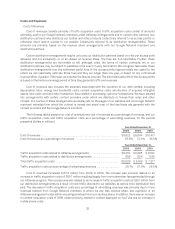
Stock-Based Compensation
The following table presents our stock-based compensation, and stock-based compensation as a percentage
of revenues for the periods presented (dollars in millions):
Year Ended December 31,
2008 2009 2010
Stock-based compensation ..................................................... $1,120 $1,164 $1,376
Stock-based compensation as a percentage of revenues ........................... 5.1% 4.9% 4.7%
Stock-based compensation increased $212 million from 2009 to 2010. This increase was largely due to
additional stock awards issued to existing and new employees.
Stock-based compensation increased $44 million from 2008 to 2009. This increase was largely due to the
modification charge recognized in 2009 related to our stock option exchange program completed in March 2009,
as well as additional stock awards issued to existing and new employees. This increase was partially offset by lower
stock-based compensation expense as a result of a significant amount of equity awards which fully vested in
2008, as well as an increase to the overall estimated forfeiture rate.
We estimate stock-based compensation to be approximately $1.6 billion in 2011 and $1.9 billion thereafter.
This estimate does not include expenses to be recognized related to employee stock awards that are granted after
December 31, 2010 or non-employee stock awards that have been or may be granted. In addition, to the extent
forfeiture rates are different from what we have anticipated, stock-based compensation related to these awards
will be different from our expectations.
Impairment of Equity Investments
In the fourth quarter of 2008, we recorded a non-cash impairment charge of $1.1 billion, which was primarily
comprised of $726 million and $355 million related to our investments in America Online, Inc. (AOL) and Clearwire
Corporation (Clearwire), respectively. We sold our investment in AOL in the second quarter of 2009.
Interest and Other Income, Net
Interest and other income, net increased $346 million from 2009 to 2010. This increase was primarily driven
by an increase in interest income of $349 million due to an increase in our cash and investment balances and
higher yields, as well as an increase in net realized gains on sales of marketable securities of $88 million. These
increases were partially offset by an increase in net foreign exchange related costs of $95 million primarily related
to our foreign exchange risk management program.
Interest and other income, net decreased $247 million from 2008 to 2009. This decrease was primarily
driven by a decrease in interest income of $160 million due to lower yields on our cash and investment balances
and an increase in net foreign exchange related costs of $88 million primarily due to more hedging activities under
our foreign exchange risk management program.
35