Google 2010 Annual Report Download - page 47
Download and view the complete annual report
Please find page 47 of the 2010 Google annual report below. You can navigate through the pages in the report by either clicking on the pages listed below, or by using the keyword search tool below to find specific information within the annual report.-
 1
1 -
2
-
3
-
4
-
5
-
6
-
7
-
8
-
9
-
10
-
11
-
12
-
13
-
14
-
15
-
16
-
17
-
18
-
19
-
20
-
21
-
22
-
23
-
24
-
25
-
26
-
27
-
28
-
29
-
30
-
31
-
32
-
33
-
34
-
35
-
36
-
 37
37 -
 38
38 -
 39
39 -
 40
40 -
 41
41 -
 42
42 -
 43
43 -
 44
44 -
 45
45 -
 46
46 -
 47
47 -
 48
48 -
 49
49 -
 50
50 -
 51
51 -
 52
52 -
 53
53 -
 54
54 -
 55
55 -
 56
56 -
 57
57 -
58
-
59
-
60
-
61
-
62
-
63
-
64
-
65
-
66
-
67
-
68
-
69
-
70
-
71
-
72
-
73
-
74
-
75
-
76
-
77
-
78
-
79
-
80
-
81
-
82
-
83
-
84
-
85
-
86
-
87
-
88
-
89
-
90
-
91
-
92
-
93
-
94
-
95
-
96
-
97
-
98
-
99
-
100
-
101
-
102
-
103
-
104
-
105
-
106
-
107
 |
 |

We expect that research and development expenses will increase in dollar amount and may increase as a
percentage of revenues in 2011 and future periods because we expect to continue to invest in building the
necessary employee and systems infrastructures required to support the development of new, and improve
existing, products and services.
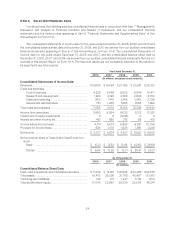
Sales and Marketing
The following table presents our sales and marketing expenses, and sales and marketing expenses as a
percentage of revenues for the periods presented (dollars in millions):
Year Ended December 31,
2008 2009 2010
Sales and marketing expenses ................................................. $1,946 $1,984 $2,799
Sales and marketing expenses as a percentage of revenues ....................... 8.9% 8.4% 9.5%
Sales and marketing expenses consist primarily of compensation and related costs for personnel engaged in
customer service, sales, and sales support functions, as well as advertising and promotional expenditures.
Sales and marketing expenses increased $815 million from 2009 to 2010. This increase was primarily due to
an increase in advertising and promotional expense of $387 million. In addition, there was an increase in labor-
related costs of $254 million, largely as a result of a 20% increase in sales and marketing headcount, and higher
commission expense.
Sales and marketing expenses increased $38 million from 2008 to 2009. This increase was primarily due to
an increase in advertising and promotional expense of $104 million, partially offset by a decrease in travel,
conference, and related expenses of $50 million.
We expect that sales and marketing expenses will increase in dollar amount and may increase as a
percentage of revenues in 2011 and future periods, as we expand our business globally, increase advertising and
promotional expenditures in connection with new and existing products, and increase the level of service we
provide to our advertisers, Google Network members, and other partners.
General and Administrative
The following table presents our general and administrative expenses, and general and administrative
expenses as a percentage of revenues for the periods presented (dollars in millions):
Year Ended December 31,
2008 2009 2010
General and administrative expenses ........................................... $1,803 $1,668 $1,962
General and administrative expenses as a percentage of revenues ................. 8.3% 7.0% 6.8%
General and administrative expenses consist primarily of compensation and related costs for personnel and
facilities, and include costs related to our facilities, finance, human resources, information technology, and legal
organizations, and fees for professional services. Professional services are principally comprised of outside legal,
audit, information technology consulting, and outsourcing services.
General and administrative expenses increased $294 million from 2009 to 2010. This increase was primarily
due to increases in professional services of $137 million, the majority of which were related to legal and temporary
services costs. In addition, there was an increase in labor-related costs of $64 million largely as a result of a 14%
increase in general and administrative headcount, and an increase in charitable contributions of $64 million.
34