Google 2010 Annual Report Download - page 63
Download and view the complete annual report
Please find page 63 of the 2010 Google annual report below. You can navigate through the pages in the report by either clicking on the pages listed below, or by using the keyword search tool below to find specific information within the annual report.-
 1
1 -
2
-
3
-
4
-
5
-
6
-
7
-
8
-
9
-
10
-
11
-
12
-
13
-
14
-
15
-
16
-
17
-
18
-
19
-
20
-
21
-
22
-
23
-
24
-
25
-
26
-
27
-
28
-
29
-
30
-
31
-
32
-
33
-
34
-
35
-
36
-
37
-
38
-
39
-
40
-
41
-
42
-
43
-
44
-
45
-
46
-
47
-
48
-
49
-
50
-
51
-
52
-
 53
53 -
 54
54 -
 55
55 -
 56
56 -
 57
57 -
 58
58 -
 59
59 -
 60
60 -
 61
61 -
 62
62 -
 63
63 -
 64
64 -
 65
65 -
 66
66 -
 67
67 -
 68
68 -
 69
69 -
 70
70 -
 71
71 -
 72
72 -
 73
73 -
74
-
75
-
76
-
77
-
78
-
79
-
80
-
81
-
82
-
83
-
84
-
85
-
86
-
87
-
88
-
89
-
90
-
91
-
92
-
93
-
94
-
95
-
96
-
97
-
98
-
99
-
100
-
101
-
102
-
103
-
104
-
105
-
106
-
107
 |
 |

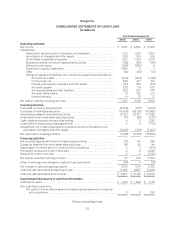
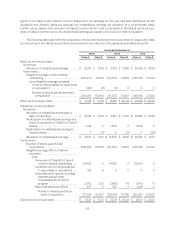
Google Inc.
CONSOLIDATED STATEMENTS OF INCOME
(In millions, except per share amounts)
Year Ended December 31,
2008 2009 2010
Revenues ................................................................ $21,796 $23,651 $ 29,321
Costs and expenses:
Cost of revenues (including stock-based compensation expense of $41, $47,
$67) ............................................................. 8,622 8,844 10,417
Research and development (including stock-based compensation expense
of $732, $725, $861) ............................................... 2,793 2,843 3,762
Sales and marketing (including stock-based compensation expense of
$206, $231, $261) ................................................. 1,946 1,984 2,799
General and administrative (including stock-based compensation expense
of $141, $161, $187) ................................................ 1,803 1,668 1,962
Total costs and expenses .................................................. 15,164 15,339 18,940
Income from operations ................................................... 6,632 8,312 10,381
Impairment of equity investments .......................................... (1,095) 0 0
Interestandotherincome,net.............................................. 316 69 415
Income before income taxes ............................................... 5,853 8,381 10,796
Provision for income taxes ................................................. 1,626 1,861 2,291
Net income .............................................................. $ 4,227 $ 6,520 $ 8,505
Net income per share of Class A and Class B common stock:
Basic ............................................................... $ 13.46 $ 20.62 $ 26.69
Diluted .............................................................. $ 13.31 $ 20.41 $ 26.31
See accompanying notes.
50