Google 2010 Annual Report Download - page 45
Download and view the complete annual report
Please find page 45 of the 2010 Google annual report below. You can navigate through the pages in the report by either clicking on the pages listed below, or by using the keyword search tool below to find specific information within the annual report.-
 1
1 -
2
-
3
-
4
-
5
-
6
-
7
-
8
-
9
-
10
-
11
-
12
-
13
-
14
-
15
-
16
-
17
-
18
-
19
-
20
-
21
-
22
-
23
-
24
-
25
-
26
-
27
-
28
-
29
-
30
-
31
-
32
-
33
-
34
-
 35
35 -
 36
36 -
 37
37 -
 38
38 -
 39
39 -
 40
40 -
 41
41 -
 42
42 -
 43
43 -
 44
44 -
 45
45 -
 46
46 -
 47
47 -
 48
48 -
 49
49 -
 50
50 -
 51
51 -
 52
52 -
 53
53 -
 54
54 -
 55
55 -
56
-
57
-
58
-
59
-
60
-
61
-
62
-
63
-
64
-
65
-
66
-
67
-
68
-
69
-
70
-
71
-
72
-
73
-
74
-
75
-
76
-
77
-
78
-
79
-
80
-
81
-
82
-
83
-
84
-
85
-
86
-
87
-
88
-
89
-
90
-
91
-
92
-
93
-
94
-
95
-
96
-
97
-
98
-
99
-
100
-
101
-
102
-
103
-
104
-
105
-
106
-
107
 |
 |

Costs and Expenses
Cost of Revenues
Cost of revenues consists primarily of traffic acquisition costs. Traffic acquisition costs consist of amounts
ultimately paid to our Google Network members under AdSense arrangements and to certain other partners (our
distribution partners) who distribute our toolbar and other products (collectively referred to as access points) or
otherwise direct search queries to our website (collectively referred to as distribution arrangements). These
amounts are primarily based on the revenue share arrangements with our Google Network members and
distribution partners.
Certain distribution arrangements require us to pay our distribution partners based on a fee per access point
delivered and not exclusively—or at all—based on revenue share. The fees are non-refundable. Further, these
distribution arrangements are terminable at will, although under the terms of certain contracts, we or our
distribution partners may be subject to penalties in the event of early termination. We recognize fees under these
distribution arrangements over the estimated useful lives of the access points (approximately two years) to the
extent we can reasonably estimate those lives and they are longer than one year, or based on any contractual
revenue share, if greater. Otherwise, we expense the fees as incurred. The estimated useful life of the access points
is based on the historical average period of time they generate traffic and revenues.
Cost of revenues also includes the expenses associated with the operation of our data centers, including
depreciation, labor, energy and bandwidth costs, content acquisition costs, amortization of acquired intangible
assets, and credit card and other transaction fees related to processing customer transactions. We have entered
into arrangements with certain content providers under which we distribute or license their video and other
content. In a number of these arrangements we display ads on the pages of our websites and our Google Network
members’ websites from which the content is viewed and share most of the fees these ads generate with the
content providers and the Google Network members.
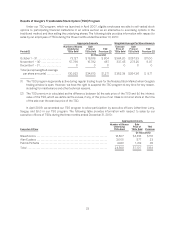
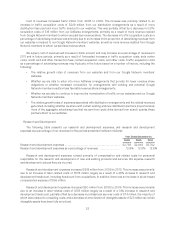
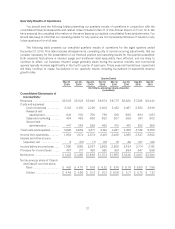
The following tables present our cost of revenues and cost of revenues as a percentage of revenues, and our
traffic acquisition costs, and traffic acquisition costs as a percentage of advertising revenues, for the periods
presented (dollars in millions):
Year Ended December 31,
2008 2009 2010
Cost of revenues ........................................................... $8,622 $8,844 $10,417
Cost of revenues as a percentage of revenues ................................. 39.6% 37.4% 35.5%
Year Ended December 31,
2008 2009 2010
Traffic acquisition costs related to AdSense arrangements ...................... $5,284 $ 5,265 $ 6,162
Traffic acquisition costs related to distribution arrangements . . . . . . . . . . . . . . . . . . . . 655 904 1,155
Total traffic acquisition costs ................................................ $5,939 $ 6,169 $ 7,317
Traffic acquisition costs as a percentage of advertising revenues ................. 28.1% 27.0% 25.9%
Cost of revenues increased $1,573 million from 2009 to 2010. The increase was primarily related to an
increase in traffic acquisition costs of $897 million resulting largely from more advertiser fees generated through
our AdSense program. The increase was also related to an increase in traffic acquisition costs of $251 million from
our distribution arrangements as a result of more traffic directed to our websites, as well as more distribution fees
paid. The decrease in traffic acquisition costs as a percentage of advertising revenues was primarily due to more
revenues realized from Google Network members to whom we pay less revenue share, and expiration of an
AdSense arrangement under which we paid guaranteed minimum revenue share. In addition, there was an increase
in content acquisition costs of $169 million primarily related to content displayed on YouTube and an increase in
mobile phone costs.
32