Google 2010 Annual Report Download - page 88
Download and view the complete annual report
Please find page 88 of the 2010 Google annual report below. You can navigate through the pages in the report by either clicking on the pages listed below, or by using the keyword search tool below to find specific information within the annual report.-
 1
1 -
2
-
3
-
4
-
5
-
6
-
7
-
8
-
9
-
10
-
11
-
12
-
13
-
14
-
15
-
16
-
17
-
18
-
19
-
20
-
21
-
22
-
23
-
24
-
25
-
26
-
27
-
28
-
29
-
30
-
31
-
32
-
33
-
34
-
35
-
36
-
37
-
38
-
39
-
40
-
41
-
42
-
43
-
44
-
45
-
46
-
47
-
48
-
49
-
50
-
51
-
52
-
53
-
54
-
55
-
56
-
57
-
58
-
59
-
60
-
61
-
62
-
63
-
64
-
65
-
66
-
67
-
68
-
69
-
70
-
71
-
72
-
73
-
74
-
75
-
76
-
77
-
 78
78 -
 79
79 -
 80
80 -
 81
81 -
 82
82 -
 83
83 -
 84
84 -
 85
85 -
 86
86 -
 87
87 -
 88
88 -
 89
89 -
 90
90 -
 91
91 -
 92
92 -
 93
93 -
 94
94 -
 95
95 -
 96
96 -
 97
97 -
 98
98 -
99
-
100
-
101
-
102
-
103
-
104
-
105
-
106
-
107
 |
 |

We estimated the fair value of each option award on the date of grant using the BSM option pricing model.
Our assumptions about stock-price volatility have been based exclusively on the implied volatilities of publicly
traded options to buy our stock with contractual terms closest to the expected life of options granted to our
employees. We estimate the expected term based upon the historical exercise behavior of our employees. The risk-
free interest rate for periods within the contractual life of the award is based on the U.S. Treasury yield curve in
effect at the time of grant.
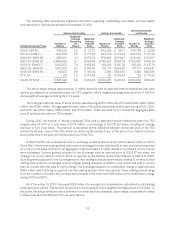
The following table presents the weighted-average assumptions used to estimate the fair values of the stock
options granted (excluding options granted in connection with the Exchange discussed below) in the periods
presented:
Year Ended December 31,
2008 2009 2010
Risk-free interest rate .................................................... 3.2% 2.6% 1.9%
Expectedvolatility ....................................................... 35% 37% 35%
Expectedlife(inyears).................................................... 5.3 5.8 5.4
Dividend yield ........................................................... 0 0 0
Weighted-average estimated fair value of options granted during the year ...... $203.58 $160.63 $216.43
The following table summarizes the activities for our options for the year ended December 31, 2010:
Options Outstanding
Number of
Shares
Weighted-
Average
Exercise Price
Weighted-
Average
Remaining
Contractual
Term
(in years)
Aggregate
Intrinsic
Value
(in millions)(1)
Balance at December 31, 2009 ...................... 12,776,488 $ 298.73
Options granted ........................... 1,743,195 $464.08
Exercised ................................ (2,518,223) $259.95
Canceled/forfeited ........................ (476,038) $ 357.52
Balance at December 31, 2010 ....................... 11,525,422 $330.24 6.3 $3,040
Vested and exercisable as of December 31, 2010 . . 6,004,433 $283.46 5.8 $ 1,865
Vested and exercisable as of December 31, 2010
and expected to vest thereafter(2) .............. 10,950,756 $ 327.58 6.3 $ 2,918
(1) The aggregate intrinsic value is calculated as the difference between the exercise price of the underlying
awards and the closing stock price of $593.97 of our Class A common stock on December 31, 2010.
(2) Options expected to vest reflect an estimated forfeiture rate.
75