Google 2010 Annual Report Download - page 46
Download and view the complete annual report
Please find page 46 of the 2010 Google annual report below. You can navigate through the pages in the report by either clicking on the pages listed below, or by using the keyword search tool below to find specific information within the annual report.-
 1
1 -
2
-
3
-
4
-
5
-
6
-
7
-
8
-
9
-
10
-
11
-
12
-
13
-
14
-
15
-
16
-
17
-
18
-
19
-
20
-
21
-
22
-
23
-
24
-
25
-
26
-
27
-
28
-
29
-
30
-
31
-
32
-
33
-
34
-
35
-
 36
36 -
 37
37 -
 38
38 -
 39
39 -
 40
40 -
 41
41 -
 42
42 -
 43
43 -
 44
44 -
 45
45 -
 46
46 -
 47
47 -
 48
48 -
 49
49 -
 50
50 -
 51
51 -
 52
52 -
 53
53 -
 54
54 -
 55
55 -
 56
56 -
57
-
58
-
59
-
60
-
61
-
62
-
63
-
64
-
65
-
66
-
67
-
68
-
69
-
70
-
71
-
72
-
73
-
74
-
75
-
76
-
77
-
78
-
79
-
80
-
81
-
82
-
83
-
84
-
85
-
86
-
87
-
88
-
89
-
90
-
91
-
92
-
93
-
94
-
95
-
96
-
97
-
98
-
99
-
100
-
101
-
102
-
103
-
104
-
105
-
106
-
107
 |
 |

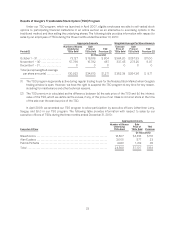
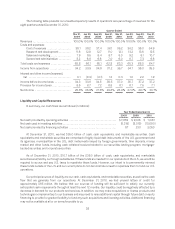
Cost of revenues increased $222 million from 2008 to 2009. The increase was primarily related to an
increase in traffic acquisition costs of $249 million from our distribution arrangements as a result of more
distribution fees paid and more traffic directed to our websites. This was partially offset by a decrease in traffic
acquisition costs of $19 million from our AdSense arrangements, primarily as a result of more revenue realized
from Google Network members to whom we paid less revenue share. The decrease in traffic acquisition costs as a
percentage of advertising revenues was primarily due to an increase in the proportion of advertising revenues from
our websites compared to our Google Network members’ websites, as well as more revenue realized from Google
Network members to whom we paid less revenue share.
We expect cost of revenues will increase in dollar amount and may increase as a percentage of revenues in
2011 and in future periods, primarily as a result of forecasted increases in traffic acquisition costs, data center
costs, credit card and other transaction fees, content acquisition costs, and other costs. Traffic acquisition costs
as a percentage of advertising revenues may fluctuate in the future based on a number of factors, including the
following:
• The relative growth rates of revenues from our websites and from our Google Network members’
websites.
• Whether we are able to enter into more AdSense arrangements that provide for lower revenue share
obligations or whether increased competition for arrangements with existing and potential Google
Network members results in less favorable revenue share arrangements.
• Whether we are able to continue to improve the monetization of traffic on our websites and our Google
Network members’ websites.
• The relative growth rates of expenses associated with distribution arrangements and the related revenues
generated, including whether we share with certain existing and new distribution partners proportionately
more of the aggregate advertising fees that we earn from paid clicks derived from search queries these
partners direct to our websites.
Research and Development
The following table presents our research and development expenses, and research and development
expenses as a percentage of our revenues for the periods presented (dollars in millions):
Year Ended December 31,
2008 2009 2010
Research and development expenses .......................................... $2,793 $2,843 $3,762
Research and development expenses as a percentage of revenues ................ 12.8% 12.0% 12.8%
Research and development expenses consist primarily of compensation and related costs for personnel
responsible for the research and development of new and existing products and services. We expense research
and development costs as they are incurred.
Research and development expenses increased $919 million from 2009 to 2010. This increase was primarily
due to an increase in labor-related costs of $578 million, largely as a result of a 28% increase in research and
development headcount, including headcount from acquisitions. In addition, there was an increase in stock-based
compensation expense of $136 million.
Research and development expenses increased $50 million from 2008 to 2009. This increase was primarily
due to an increase in labor-related costs of $138 million, largely as a result of a 14% increase in research and
development headcount, partially offset by a decrease in professional services costs of $74 million, the majority of
which were related to consulting costs, and a decrease in amortization of intangible assets of $23 million as certain
intangible assets have been fully amortized.
33