Google 2010 Annual Report Download - page 35
Download and view the complete annual report
Please find page 35 of the 2010 Google annual report below. You can navigate through the pages in the report by either clicking on the pages listed below, or by using the keyword search tool below to find specific information within the annual report.-
 1
1 -
2
-
3
-
4
-
5
-
6
-
7
-
8
-
9
-
10
-
11
-
12
-
13
-
14
-
15
-
16
-
17
-
18
-
19
-
20
-
21
-
22
-
23
-
24
-
 25
25 -
 26
26 -
 27
27 -
 28
28 -
 29
29 -
 30
30 -
 31
31 -
 32
32 -
 33
33 -
 34
34 -
 35
35 -
 36
36 -
 37
37 -
 38
38 -
 39
39 -
 40
40 -
 41
41 -
 42
42 -
 43
43 -
 44
44 -
 45
45 -
46
-
47
-
48
-
49
-
50
-
51
-
52
-
53
-
54
-
55
-
56
-
57
-
58
-
59
-
60
-
61
-
62
-
63
-
64
-
65
-
66
-
67
-
68
-
69
-
70
-
71
-
72
-
73
-
74
-
75
-
76
-
77
-
78
-
79
-
80
-
81
-
82
-
83
-
84
-
85
-
86
-
87
-
88
-
89
-
90
-
91
-
92
-
93
-
94
-
95
-
96
-
97
-
98
-
99
-
100
-
101
-
102
-
103
-
104
-
105
-
106
-
107
 |
 |
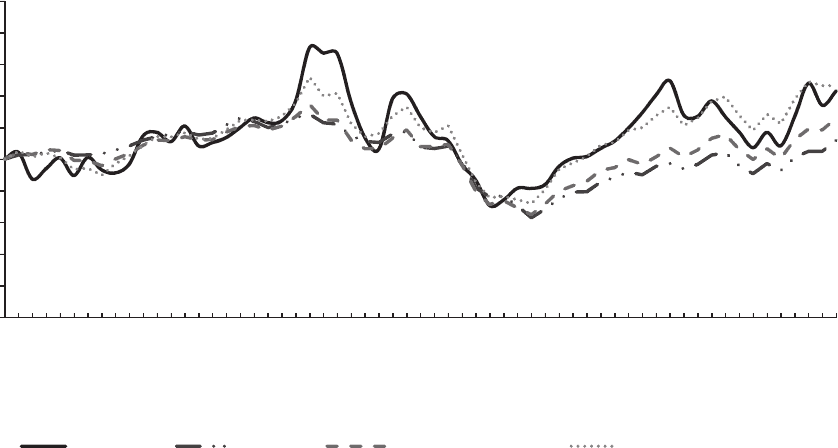
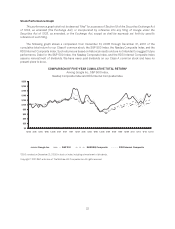
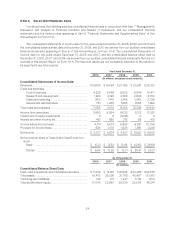
Stock Performance Graph
This performance graph shall not be deemed “filed” for purposes of Section 18 of the Securities Exchange Act
of 1934, as amended (the Exchange Act), or incorporated by reference into any filing of Google under the
Securities Act of 1933, as amended, or the Exchange Act, except as shall be expressly set forth by specific
reference in such filing.
The following graph shows a comparison from December 31, 2005 through December 31, 2010 of the
cumulative total return for our Class A common stock, the S&P 500 Index, the Nasdaq Composite Index, and the
RDG Internet Composite Index. Such returns are based on historical results and are not intended to suggest future
performance. Data for the S&P 500 Index, the Nasdaq Composite Index, and the RDG Internet Composite Index
assume reinvestment of dividends. We have never paid dividends on our Class A common stock and have no
present plans to do so.
COMPARISON OF FIVE-YEAR CUMULATIVE TOTAL RETURN*
Among Google Inc., S&P 500 Index,
Nasdaq Composite Index and RDG Internet Composite Index
$0
$20
$40
$60
$80
$100
$120
$140
$160
$180
$200
12/05 3/06 6/06 9/06 12/06 3/07 6/07 9/07 12/07 3/08 6/08 9/08 12/08 3/09 6/09 9/09 12/09 3/10 6/10 9/10 12/10
Google Inc. S&P 500 NASDAQ Composite RDG Internet Composite
*$100 invested on December 31, 2005 in stock or index, including reinvestment of dividends.
Copyright ©2011 S&P, a division of The McGraw-Hill Companies Inc. All rights reserved.
22