Google 2010 Annual Report Download - page 73
Download and view the complete annual report
Please find page 73 of the 2010 Google annual report below. You can navigate through the pages in the report by either clicking on the pages listed below, or by using the keyword search tool below to find specific information within the annual report.-
 1
1 -
2
-
3
-
4
-
5
-
6
-
7
-
8
-
9
-
10
-
11
-
12
-
13
-
14
-
15
-
16
-
17
-
18
-
19
-
20
-
21
-
22
-
23
-
24
-
25
-
26
-
27
-
28
-
29
-
30
-
31
-
32
-
33
-
34
-
35
-
36
-
37
-
38
-
39
-
40
-
41
-
42
-
43
-
44
-
45
-
46
-
47
-
48
-
49
-
50
-
51
-
52
-
53
-
54
-
55
-
56
-
57
-
58
-
59
-
60
-
61
-
62
-
 63
63 -
 64
64 -
 65
65 -
 66
66 -
 67
67 -
 68
68 -
 69
69 -
 70
70 -
 71
71 -
 72
72 -
 73
73 -
 74
74 -
 75
75 -
 76
76 -
 77
77 -
 78
78 -
 79
79 -
 80
80 -
 81
81 -
 82
82 -
 83
83 -
84
-
85
-
86
-
87
-
88
-
89
-
90
-
91
-
92
-
93
-
94
-
95
-
96
-
97
-
98
-
99
-
100
-
101
-
102
-
103
-
104
-
105
-
106
-
107
 |
 |

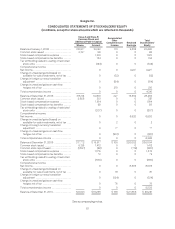
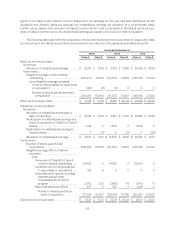
The net income per share amounts are the same for Class A and Class B common stock because the holders
of each class are legally entitled to equal per share distributions whether through dividends or in liquidation.
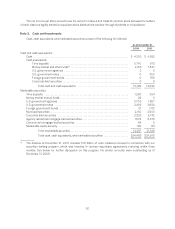
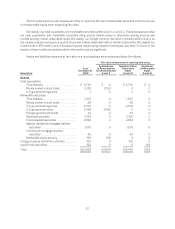
Note 3. Cash and Investments
Cash, cash equivalents, and marketable securities consist of the following (in millions):
As of December 31,
2009 2010
Cash and cash equivalents:
Cash ........................................................................ $ 4,303 $ 4,652
Cash equivalents:
Time deposits ............................................................ 3,740 973
Money market and other funds(1) ............................................ 2,153 7,547
U.S. government agencies ................................................. 2 0
U.S.governmentnotes .................................................... 0 300
Foreigngovernmentbonds ................................................ 0 150
Corporate debt securities .................................................. 0 8
Total cash and cash equivalents ....................................... 10,198 13,630
Marketable securities:
Time deposits ................................................................ 1,250 304
Moneymarketmutualfunds.................................................... 28 3
U.S. government agencies ..................................................... 3,703 1,857
U.S. government notes ........................................................ 2,492 3,930
Foreigngovernmentbonds..................................................... 37 1,172
Municipal securities ........................................................... 2,130 2,503
Corporate debt securities ...................................................... 2,822 5,742
Agency residential mortgage-backed securities ................................... 1,578 5,673
Commercial mortgage-backed securities . . . . . . . . . . . . . . . . . . . . . . . . . . . . . . . . . . . . . . . . 48 0
Marketableequitysecurity ..................................................... 199 161
Total marketable securities ............................................ 14,287 21,345
Total cash, cash equivalents, and marketable securities ................... $24,485 $34,975
(1) The balance at December 31, 2010 includes $1.6 billion of cash collateral received in connection with our
securities lending program, which was invested in reverse repurchase agreements maturing within three
months. See below for further discussion on this program. No similar amounts were outstanding as of
December 31, 2009.
60