Google 2010 Annual Report Download - page 74
Download and view the complete annual report
Please find page 74 of the 2010 Google annual report below. You can navigate through the pages in the report by either clicking on the pages listed below, or by using the keyword search tool below to find specific information within the annual report.-
 1
1 -
2
-
3
-
4
-
5
-
6
-
7
-
8
-
9
-
10
-
11
-
12
-
13
-
14
-
15
-
16
-
17
-
18
-
19
-
20
-
21
-
22
-
23
-
24
-
25
-
26
-
27
-
28
-
29
-
30
-
31
-
32
-
33
-
34
-
35
-
36
-
37
-
38
-
39
-
40
-
41
-
42
-
43
-
44
-
45
-
46
-
47
-
48
-
49
-
50
-
51
-
52
-
53
-
54
-
55
-
56
-
57
-
58
-
59
-
60
-
61
-
62
-
63
-
 64
64 -
 65
65 -
 66
66 -
 67
67 -
 68
68 -
 69
69 -
 70
70 -
 71
71 -
 72
72 -
 73
73 -
 74
74 -
 75
75 -
 76
76 -
 77
77 -
 78
78 -
 79
79 -
 80
80 -
 81
81 -
 82
82 -
 83
83 -
 84
84 -
85
-
86
-
87
-
88
-
89
-
90
-
91
-
92
-
93
-
94
-
95
-
96
-
97
-
98
-
99
-
100
-
101
-
102
-
103
-
104
-
105
-
106
-
107
 |
 |

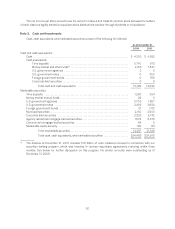
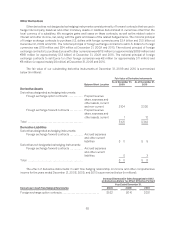
The following table summarizes unrealized gains and losses related to our investments in marketable
securities designated as available-for-sale (in millions):
As of December 31, 2009
Adjusted
Cost
Gross
Unrealized
Gains
Gross
Unrealized
Losses Fair
Value
Time deposits ................................................ $ 1,250 $ 0 $ 0 $ 1,250
Moneymarketmutualfunds ................................... 28 0 0 28
U.S. government agencies ..................................... 3,700 5 (2) 3,703
U.S. government notes ........................................ 2,520 0 (28) 2,492
Foreigngovernmentbonds .................................... 37 0 0 37
Municipal securities ........................................... 2,100 30 0 2,130
Corporate debt securities ...................................... 2,826 13 (17) 2,822
Agency residential mortgage-backed securities .................. 1,585 5 (12) 1,578
Commercial mortgage-backed securities . . . . . . . . . . . . . . . . . . . . . . . . 47 1 0 48
Marketableequitysecurity..................................... 145 54 0 199
Total ................................................... $14,238 $108 $(59) $14,287
As of December 31, 2010
Adjusted
Cost
Gross
Unrealized
Gains
Gross
Unrealized
Losses Fair
Value
Timedeposits ................................................ $ 304 $ 0 $ 0 $ 304
Money market mutual funds.................................... 3 0 0 3
U.S. government agencies ..................................... 1,864 1 (8) 1,857
U.S. government notes ........................................ 3,950 30 (50) 3,930
Foreign government bonds .................................... 1,154 23 (5) 1,172
Municipal securities ........................................... 2,492 16 (5) 2,503
Corporate debt securities ...................................... 5,600 167 (25) 5,742
Agency residential mortgage-backed securities .................. 5,649 56 (32) 5,673
Marketableequitysecurity ..................................... 150 11 0 161
Total .................................................... $21,166 $304 $(125) $21,345
Gross unrealized gains and losses on cash equivalents were not material at December 31, 2009 and
December 31, 2010.
We recognized gross realized gains of $118 million and $212 million for the years ended December 31, 2009
and 2010. Gross realized losses for the year ended December 31, 2009 were not material. Gross realized losses for
the year ended December 31, 2010 were $27 million. We determine realized gains or losses on the sale of
marketable securities on a specific identification method, and we reflect such gains and losses as a component of
interest and other income, net, in our accompanying Consolidated Statements of Income.
61