Google 2008 Annual Report Download - page 94
Download and view the complete annual report
Please find page 94 of the 2008 Google annual report below. You can navigate through the pages in the report by either clicking on the pages listed below, or by using the keyword search tool below to find specific information within the annual report.-
 1
1 -
2
-
3
-
4
-
5
-
6
-
7
-
8
-
9
-
10
-
11
-
12
-
13
-
14
-
15
-
16
-
17
-
18
-
19
-
20
-
21
-
22
-
23
-
24
-
25
-
26
-
27
-
28
-
29
-
30
-
31
-
32
-
33
-
34
-
35
-
36
-
37
-
38
-
39
-
40
-
41
-
42
-
43
-
44
-
45
-
46
-
47
-
48
-
49
-
50
-
51
-
52
-
53
-
54
-
55
-
56
-
57
-
58
-
59
-
60
-
61
-
62
-
63
-
64
-
65
-
66
-
67
-
68
-
69
-
70
-
71
-
72
-
73
-
74
-
75
-
76
-
77
-
78
-
79
-
80
-
81
-
82
-
83
-
 84
84 -
 85
85 -
 86
86 -
 87
87 -
 88
88 -
 89
89 -
 90
90 -
 91
91 -
 92
92 -
 93
93 -
 94
94 -
 95
95 -
 96
96 -
 97
97 -
 98
98 -
 99
99 -
 100
100 -
 101
101 -
 102
102 -
 103
103 -
 104
104 -
105
-
106
-
107
-
108
-
109
-
110
-
111
-
112
-
113
-
114
-
115
-
116
-
117
-
118
-
119
-
120
-
121
-
122
-
123
-
124
-
125
-
126
-
127
-
128
-
129
-
130
 |
 |

Google Inc.
NOTES TO CONSOLIDATED FINANCIAL STATEMENTS—(Continued)
The net income per share amounts are the same for Class A and Class B because the holders of each class
are legally entitled to equal per share distributions whether through dividends or in liquidation.
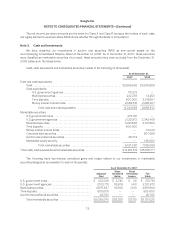
Note 3. Cash and Investments
We have classified our investments in auction rate securities (ARS) as non-current assets on the
accompanying Consolidated Balance Sheet at December 31, 2008. As of December 31, 2007, these securities
were classified as marketable securities. As a result, these amounts have been excluded from the December 31,
2008 balances in the tables below.
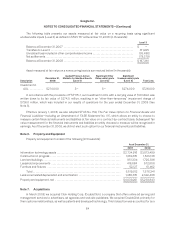
Cash, cash equivalents and marketable securities consist of the following (in thousands):
As of December 31,
2007 2008
Cash and cash equivalents:
Cash .................................................................. $2,869,528 $3,330,658
Cash equivalents:
U.S. government agencies ........................................... 110,272 —
Municipal securities ................................................ 232,278 14,250
Time deposits ...................................................... 500,000 3,015,557
Money market mutual funds ......................................... 2,369,515 2,296,207
Total cash and cash equivalents ................................. 6,081,593 8,656,672
Marketable securities:
U.S. government notes .................................................. 475,781 —
U.S. government agencies ............................................... 2,120,972 3,342,406
Municipal securities ..................................................... 4,991,564 2,721,603
Time deposits .......................................................... 500,000 —
Money market mutual funds ............................................. — 73,034
Corporate debt securities ................................................ — 907,056
Auction rate preferred securities .......................................... 48,703 —
Marketable equity security ............................................... — 145,000
Total marketable securities ..................................... 8,137,020 7,189,099
Total cash, cash equivalents and marketable securities .......................... $14,218,613 $15,845,771
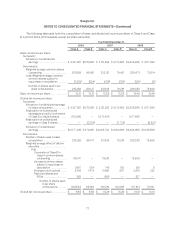
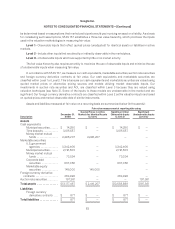
The following table summarizes unrealized gains and losses related to our investments in marketable
securities designated as available-for-sale (in thousands):
As of December 31, 2007
Adjusted
Cost
Gross
Unrealized
Gains
Gross
Unrealized
Losses Fair
Value
U.S. government notes ................................. $ 472,040 $ 3,745 $ (4) $ 475,781
U.S. government agencies .............................. 2,102,710 18,306 (44) 2,120,972
Municipal securities ................................... 4,975,587 16,308 (331) 4,991,564
Time deposits ......................................... 500,000 — — 500,000
Auction rate preferred securities ........................ 48,703 — — 48,703
Total marketable securities ........................ $8,099,040 $38,359 $(379) $8,137,020
78