Google 2008 Annual Report Download - page 69
Download and view the complete annual report
Please find page 69 of the 2008 Google annual report below. You can navigate through the pages in the report by either clicking on the pages listed below, or by using the keyword search tool below to find specific information within the annual report.-
 1
1 -
2
-
3
-
4
-
5
-
6
-
7
-
8
-
9
-
10
-
11
-
12
-
13
-
14
-
15
-
16
-
17
-
18
-
19
-
20
-
21
-
22
-
23
-
24
-
25
-
26
-
27
-
28
-
29
-
30
-
31
-
32
-
33
-
34
-
35
-
36
-
37
-
38
-
39
-
40
-
41
-
42
-
43
-
44
-
45
-
46
-
47
-
48
-
49
-
50
-
51
-
52
-
53
-
54
-
55
-
56
-
57
-
58
-
 59
59 -
 60
60 -
 61
61 -
 62
62 -
 63
63 -
 64
64 -
 65
65 -
 66
66 -
 67
67 -
 68
68 -
 69
69 -
 70
70 -
 71
71 -
 72
72 -
 73
73 -
 74
74 -
 75
75 -
 76
76 -
 77
77 -
 78
78 -
 79
79 -
80
-
81
-
82
-
83
-
84
-
85
-
86
-
87
-
88
-
89
-
90
-
91
-
92
-
93
-
94
-
95
-
96
-
97
-
98
-
99
-
100
-
101
-
102
-
103
-
104
-
105
-
106
-
107
-
108
-
109
-
110
-
111
-
112
-
113
-
114
-
115
-
116
-
117
-
118
-
119
-
120
-
121
-
122
-
123
-
124
-
125
-
126
-
127
-
128
-
129
-
130
 |
 |

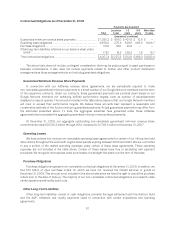
the net gains and losses recognized by legal entities on certain hedges and related hedged intercompany and other
transactions under our foreign exchange risk management program, changes in the valuation of our deferred tax
assets or liabilities, or changes in tax laws, regulations, accounting principles, or interpretations thereof. In addition,
we are subject to the continuous examination of our income tax returns by the Internal Revenue Service and other
tax authorities. We regularly assess the likelihood of adverse outcomes resulting from these examinations to
determine the adequacy of our provision for income taxes.
See Critical Accounting Policies and Estimates included elsewhere in this Annual Report on Form 10-K for
additional information about our provision for income taxes.
A reconciliation of the federal statutory income tax rate to our effective tax rate is set forth in Note 14 of
Notes to Consolidated Financial Statements included in this Annual Report on Form 10-K.
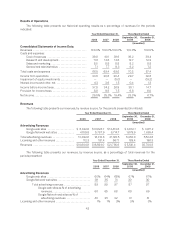
Quarterly Results of Operations
You should read the following tables presenting our quarterly results of operations in conjunction with the
consolidated financial statements and related notes contained elsewhere in this Annual Report on Form 10-K. We
have prepared the unaudited information on the same basis as our audited consolidated financial statements. You
should also keep in mind, as you read the following tables, that our operating results for any quarter are not
necessarily indicative of results for any future quarters or for a full year.
The following table presents our unaudited quarterly results of operations for the eight quarters ended
December 31, 2008. This table includes all adjustments, consisting only of normal recurring adjustments, that we
consider necessary for fair presentation of our financial position and operating results for the quarters presented.
Both seasonal fluctuations in internet usage and traditional retail seasonality have affected, and are likely to
continue to affect, our business. Internet usage generally slows during the summer months, and commercial
queries typically increase significantly in the fourth quarter of each year. These seasonal trends have caused and
will likely continue to cause, fluctuations in our quarterly results, including fluctuations in sequential revenue
growth rates.
Quarter Ended
Mar 31,
2007 Jun 30,
2007 Sep 30,
2007 Dec 31,
2007 Mar 31,
2008 Jun 30,
2008 Sep 30,
2008 Dec 31,
2008
(in millions, except per share amounts)
(unaudited)
Consolidated Statements of
Income Data:
Revenues ........................ $3,664.0 $3,872.0 $ 4,231.3 $ 4,826.7 $ 5,186.1 $5,367.2 $ 5,541.4 $ 5,700.9
Costs and expenses:
Cost of revenues ............. 1,470.4 1,560.3 1,662.6 1,955.8 2,110.5 2,147.6 2,173.4 2,190.0
Research and development .... 408.4 532.1 548.7 630.8 673.1 682.2 704.6 733.3
Sales and marketing .......... 302.6 355.6 380.8 422.3 446.9 484.5 508.8 506.0
General and administrative .... 261.4 319.4 321.4 377.1 409.3 474.8 507.1 411.4
Total costs and expenses .......... 2,442.8 2,767.4 2,913.5 3,386.0 3,639.8 3,789.1 3,893.9 3,840.7
Income from operations ........... 1,221.2 1,104.6 1,317.8 1,440.7 1,546.3 1,578.1 1,647.5 1,860.2
Impairment of equity investments . . . — — — — — — — (1,094,8)
Interest income and other, net ...... 130.8 137.1 154.5 167.3 167.3 57.9 21.2 69.9
Income before income taxes ........ 1,352.0 1,241.7 1,472.3 1,608.0 1,713.6 1,636.0 1,668.7 835.3
Provision for income taxes ......... 349.8 316.6 402.3 401.6 406.5 388.5 378.8 452.9
Net income ....................... $1,002.2 $ 925.1 $1,070.0 $ 1,206.4 $ 1,307.1 $ 1,247.5 $ 1,289.9 $ 382.4
Net income per share of Class A and
Class B common stock:
Basic ........................ $ 3.24 $ 2.98 $ 3.44 $ 3.86 $ 4.17 $ 3.97 $ 4.10 $ 1.22
Diluted ...................... $ 3.18 $ 2.93 $ 3.38 $ 3.79 $ 4.12 $ 3.92 $ 4.06 $ 1.21
53