Google 2008 Annual Report Download - page 100
Download and view the complete annual report
Please find page 100 of the 2008 Google annual report below. You can navigate through the pages in the report by either clicking on the pages listed below, or by using the keyword search tool below to find specific information within the annual report.-
 1
1 -
2
-
3
-
4
-
5
-
6
-
7
-
8
-
9
-
10
-
11
-
12
-
13
-
14
-
15
-
16
-
17
-
18
-
19
-
20
-
21
-
22
-
23
-
24
-
25
-
26
-
27
-
28
-
29
-
30
-
31
-
32
-
33
-
34
-
35
-
36
-
37
-
38
-
39
-
40
-
41
-
42
-
43
-
44
-
45
-
46
-
47
-
48
-
49
-
50
-
51
-
52
-
53
-
54
-
55
-
56
-
57
-
58
-
59
-
60
-
61
-
62
-
63
-
64
-
65
-
66
-
67
-
68
-
69
-
70
-
71
-
72
-
73
-
74
-
75
-
76
-
77
-
78
-
79
-
80
-
81
-
82
-
83
-
84
-
85
-
86
-
87
-
88
-
89
-
 90
90 -
 91
91 -
 92
92 -
 93
93 -
 94
94 -
 95
95 -
 96
96 -
 97
97 -
 98
98 -
 99
99 -
 100
100 -
 101
101 -
 102
102 -
 103
103 -
 104
104 -
 105
105 -
 106
106 -
 107
107 -
 108
108 -
 109
109 -
 110
110 -
111
-
112
-
113
-
114
-
115
-
116
-
117
-
118
-
119
-
120
-
121
-
122
-
123
-
124
-
125
-
126
-
127
-
128
-
129
-
130
 |
 |

Google Inc.
NOTES TO CONSOLIDATED FINANCIAL STATEMENTS—(Continued)
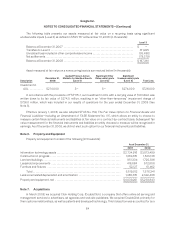
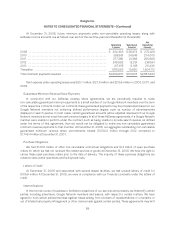
The following table presents our assets measured at fair value on a recurring basis using significant
unobservable inputs (Level 3) as defined in SFAS 157 at December 31, 2008 (in thousands):
Level 3
Balance at December 31, 2007 ..................................................... $ —
Transfers to Level 3 ............................................................... 311,225
Unrealized loss included in other comprehensive income ............................... (35,485)
Net settlements ................................................................... (78,379)
Balance at December 31, 2008 ..................................................... $197,361
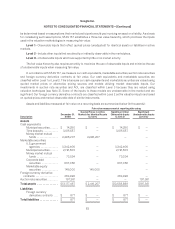
Asset measured at fair value on a nonrecurring basis is summarized below (in thousands):
Description December 31,
2008
Quoted Prices in Active
Markets for Identical Assets
(Level 1)
Significant Other
Observable Inputs
(Level 2)
Significant
Unobservable Inputs
(Level 3) Total Loss
Investment in
AOL .......... $274,000 $— $— $274,000 $726,000
In accordance with the provisions of FSP 115-1, our investment in AOL with a carrying value of $1.0 billion was
written down to its fair value of $274.0 million, resulting in an “other-than-temporary” impairment charge of
$726.0 million, which was included in our results of operations for the year ended December 31, 2008 (See
Note 3).
Effective January 1, 2008, we also adopted SFAS No. 159, The Fair Value Option for Financial Assets and
Financial Liabilities—Including an Amendment of FASB Statement No. 115, which allows an entity to choose to
measure certain financial instruments and liabilities at fair value on a contract-by-contract basis. Subsequent fair
value measurement for the financial instruments and liabilities an entity chooses to measure will be recognized in
earnings. As of December 31, 2008, we did not elect such option for our financial instruments and liabilities.
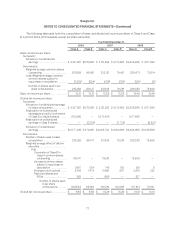
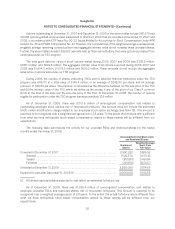
Note 6. Property and Equipment
Property and equipment consist of the following (in thousands):
As of December 31,
2007 2008
Information technology assets ................................................. $2,734,916 $3,573,499
Construction in progress ...................................................... 1,364,651 1,643,136
Land and buildings ........................................................... 951,334 1,725,336
Leasehold improvements ..................................................... 416,884 572,908
Furniture and fixtures ........................................................ 52,127 61,462
Total ................................................................... 5,519,912 7,576,341
Less accumulated depreciation and amortization ................................ 1,480,651 2,342,498
Property and equipment, net .................................................. $4,039,261 $5,233,843
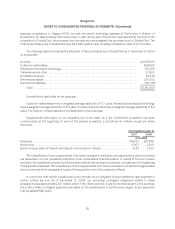
Note 7. Acquisitions
In March 2008, we acquired Click Holding Corp. (DoubleClick), a company that offers online ad serving and
management services to advertisers, ad agencies and web site publishers. We acquired DoubleClick primarily for
their customer relationships, as well as patents and developed technology. This transaction was accounted for as a
84