Google 2008 Annual Report Download - page 53
Download and view the complete annual report
Please find page 53 of the 2008 Google annual report below. You can navigate through the pages in the report by either clicking on the pages listed below, or by using the keyword search tool below to find specific information within the annual report.-
 1
1 -
2
-
3
-
4
-
5
-
6
-
7
-
8
-
9
-
10
-
11
-
12
-
13
-
14
-
15
-
16
-
17
-
18
-
19
-
20
-
21
-
22
-
23
-
24
-
25
-
26
-
27
-
28
-
29
-
30
-
31
-
32
-
33
-
34
-
35
-
36
-
37
-
38
-
39
-
40
-
41
-
42
-
 43
43 -
 44
44 -
 45
45 -
 46
46 -
 47
47 -
 48
48 -
 49
49 -
 50
50 -
 51
51 -
 52
52 -
 53
53 -
 54
54 -
 55
55 -
 56
56 -
 57
57 -
 58
58 -
 59
59 -
 60
60 -
 61
61 -
 62
62 -
 63
63 -
64
-
65
-
66
-
67
-
68
-
69
-
70
-
71
-
72
-
73
-
74
-
75
-
76
-
77
-
78
-
79
-
80
-
81
-
82
-
83
-
84
-
85
-
86
-
87
-
88
-
89
-
90
-
91
-
92
-
93
-
94
-
95
-
96
-
97
-
98
-
99
-
100
-
101
-
102
-
103
-
104
-
105
-
106
-
107
-
108
-
109
-
110
-
111
-
112
-
113
-
114
-
115
-
116
-
117
-
118
-
119
-
120
-
121
-
122
-
123
-
124
-
125
-
126
-
127
-
128
-
129
-
130
 |
 |

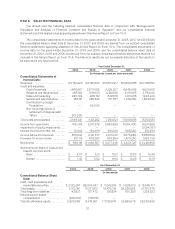
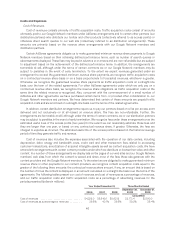
ITEM 6. SELECTED FINANCIAL DATA
You should read the following selected consolidated financial data in conjunction with “Management’s
Discussion and Analysis of Financial Condition and Results of Operation” and our consolidated financial
statements and the related notes appearing elsewhere in this Annual Report on Form 10-K.
The consolidated statements of income data for the years ended December 31, 2006, 2007 and 2008 and
the consolidated balance sheet data at December 31, 2007, and 2008, are derived from our audited consolidated
financial statements appearing elsewhere in this Annual Report on Form 10-K. The consolidated statements of
income data for the years ended December 31, 2004 and 2005, and the consolidated balance sheet data at
December 31, 2004, 2005 and 2006, are derived from our audited consolidated financial statements that are not
included in this Annual Report on Form 10-K. The historical results are not necessarily indicative of the results to
be expected in any future period.
Year Ended December 31,
2004 2005 2006 2007 2008
(in thousands, except per share amounts)
Consolidated Statements of
Income Data:
Revenues ......................... $3,189,223 $6,138,560 $10,604,917 $16,593,986 $21,795,550
Costs and expenses:
Cost of revenues .............. 1,468,967 2,577,088 4,225,027 6,649,085 8,621,506
Research and development ..... 395,164 599,510 1,228,589 2,119,985 2,793,192
Sales and marketing ........... 295,749 468,152 849,518 1,461,266 1,946,244
General and administrative ..... 188,151 386,532 751,787 1,279,250 1,802,639
Contribution to Google
Foundation ................. — 90,000 — — —
Non-recurring portion of
settlement of disputes with
Yahoo ..................... 201,000 — — — —
Total costs and expenses ........... 2,549,031 4,121,282 7,054,921 11,509,586 15,163,581
Income from operations ............ 640,192 2,017,278 3,549,996 5,084,400 6,631,969
Impairment of equity investments .... — — — — (1,094,757)
Interest income and other, net ....... 10,042 124,399 461,044 589,580 316,384
Income before income taxes ........ 650,234 2,141,677 4,011,040 5,673,980 5,853,596
Provision for income taxes .......... 251,115 676,280 933,594 1,470,260 1,626,738
Net income ........................ $ 399,119 $ 1,465,397 $ 3,077,446 $ 4,203,720 $ 4,226,858
Net income per share of Class A and
Class B common stock
Basic ........................ $ 2.07 $ 5.31 $ 10.21 $ 13.53 $ 13.46
Diluted ....................... $ 1.46 $ 5.02 $ 9.94 $ 13.29 $ 13.31
As of December 31,
2004 2005 2006 2007 2008
(in thousands)
Consolidated Balance Sheet
Data:
Cash, cash equivalents and
marketable securities .......... $2,132,297 $8,034,247 $ 11,243,914 $ 14,218,613 $ 15,845,771
Total assets ..................... 3,313,351 10,271,813 18,473,351 25,335,806 31,767,575
Total long-term liabilities .......... 43,927 107,472 128,924 610,525 1,226,623
Deferred stock-based
compensation ................. (249,470) (119,015) — — —
Total stockholders’ equity ......... 2,929,056 9,418,957 17,039,840 22,689,679 28,238,862
37