Google 2008 Annual Report Download - page 60
Download and view the complete annual report
Please find page 60 of the 2008 Google annual report below. You can navigate through the pages in the report by either clicking on the pages listed below, or by using the keyword search tool below to find specific information within the annual report.-
 1
1 -
2
-
3
-
4
-
5
-
6
-
7
-
8
-
9
-
10
-
11
-
12
-
13
-
14
-
15
-
16
-
17
-
18
-
19
-
20
-
21
-
22
-
23
-
24
-
25
-
26
-
27
-
28
-
29
-
30
-
31
-
32
-
33
-
34
-
35
-
36
-
37
-
38
-
39
-
40
-
41
-
42
-
43
-
44
-
45
-
46
-
47
-
48
-
49
-
 50
50 -
 51
51 -
 52
52 -
 53
53 -
 54
54 -
 55
55 -
 56
56 -
 57
57 -
 58
58 -
 59
59 -
 60
60 -
 61
61 -
 62
62 -
 63
63 -
 64
64 -
 65
65 -
 66
66 -
 67
67 -
 68
68 -
 69
69 -
 70
70 -
71
-
72
-
73
-
74
-
75
-
76
-
77
-
78
-
79
-
80
-
81
-
82
-
83
-
84
-
85
-
86
-
87
-
88
-
89
-
90
-
91
-
92
-
93
-
94
-
95
-
96
-
97
-
98
-
99
-
100
-
101
-
102
-
103
-
104
-
105
-
106
-
107
-
108
-
109
-
110
-
111
-
112
-
113
-
114
-
115
-
116
-
117
-
118
-
119
-
120
-
121
-
122
-
123
-
124
-
125
-
126
-
127
-
128
-
129
-
130
 |
 |
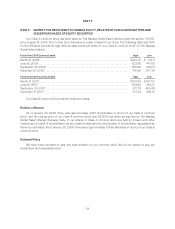
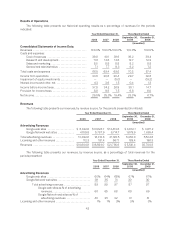
Growth in our revenues from the three months ended September 30, 2008 to the three months ended
December 31, 2008 results primarily from the growth in advertising revenues for Google web sites and to a lesser
extent, Google Network members’ web sites. Our advertising revenue growth for Google web sites and Google
Network members’ web sites resulted primarily from an increase in the number of paid clicks through our advertising
programs, partially offset by the decrease in the average fees paid by our advertisers. The increase in the number of
paid clicks through our advertising programs was due to an increase in aggregate traffic both on our web sites and
the websites of our Google Network members, certain monetization improvements and the continued global
expansion of our products, our advertiser base and our user base.
Growth in our revenues from 2007 to 2008 and from 2006 to 2007 resulted primarily from growth in
advertising revenues for Google web sites, and to a lesser extent, Google Network members’ web sites. Our
advertising revenue growth for Google web sites and Google Network members’ web sites resulted primarily from
an increase in the number of paid clicks through our advertising programs.
Improvements in our ability to ultimately monetize increased traffic primarily relate to enhancing the end user
experience, including providing end users with ads that are more relevant to their search queries or to the content
on the Google Network members’ web sites they visit. These improvements have included, for instance, a change
to the formula used to determine which ads appear at the top of our search results pages, a change to consider not
only a user’s current search query, but also their immediately preceding query to determine the ads displayed on
our search results pages, a change to the clickable area around our AdSense for content text-based ads to only the
title and URL to reduce the number of accidental clicks, a change to replace minimum bids with first-page bids
which is an estimate of the bid it would take for an ad to reach the first page of our search results pages, as well as
changes to further enhance the accuracy of our quality scoring, which is our measurement of an ad’s quality.
Our sequential quarterly revenue growth rate decreased from 3.2% for the three months ended
September 30, 2008, to 2.9% for the three months ended December 31, 2008.
The sequential quarterly revenue growth rate from Google web sites decreased from 4.0% for the three
months ended September 30, 2008, to 3.8% for the three months ended December 31, 2008. The sequential
quarterly revenue growth rate from our Google Network members’ web sites decreased from 1.5% for the three
months ended September 30, 2008, to 0.8% for the three months ended December 31, 2008. The decrease in
the sequential quarterly revenue growth rates from Google web sites and Google Network members’ web sites is
primarily due to a more unfavorable impact as a result of the strengthening of the U.S. dollar relative to other
foreign currencies (primarily the Euro and the British pound) and a greater decline in average fees paid, partially
offset by higher traffic growth and an increase in gains realized from our foreign exchange risk management
program. The sequential quarterly revenue growth from Google web sites has been greater than that from our
Google Network members’ web sites primarily as a result of higher traffic growth and certain monetization
improvements on Google web sites. We expect that our revenue growth rates will generally decline in the future as
a result of increasing competition and the difficulty of maintaining growth rates as our revenues increase to higher
levels. In addition, the current general economic downturn may result in fewer commercial queries by our users and
may cause advertisers to reduce the amount they spend on online advertising, which could negatively affect the
growth rate of our revenues.
Aggregate paid clicks on Google web sites and our Google Network members’ web sites increased
approximately 10% from the three months ended September 30, 2008 to the three months ended December 31,
2008, approximately 18% from the year ended 2007 to the year ended 2008 and approximately 43% from the
year ended 2006 to the year ended 2007. In general, the increase in paid clicks has historically correlated with
increases in our revenues. However, the rate of increase in paid clicks, and its correlation with the rate of increase
in revenues, may fluctuate from quarter to quarter based on various factors including seasonality, advertiser
competition for keywords, the revenue growth rates on our web sites compared to those of our Google Network
members and the current general economic downturn. In addition, traffic growth in emerging markets compared
to more mature markets and across various advertising verticals also contributes to these fluctuations.
44