Google 2008 Annual Report Download - page 61
Download and view the complete annual report
Please find page 61 of the 2008 Google annual report below. You can navigate through the pages in the report by either clicking on the pages listed below, or by using the keyword search tool below to find specific information within the annual report.-
 1
1 -
2
-
3
-
4
-
5
-
6
-
7
-
8
-
9
-
10
-
11
-
12
-
13
-
14
-
15
-
16
-
17
-
18
-
19
-
20
-
21
-
22
-
23
-
24
-
25
-
26
-
27
-
28
-
29
-
30
-
31
-
32
-
33
-
34
-
35
-
36
-
37
-
38
-
39
-
40
-
41
-
42
-
43
-
44
-
45
-
46
-
47
-
48
-
49
-
50
-
 51
51 -
 52
52 -
 53
53 -
 54
54 -
 55
55 -
 56
56 -
 57
57 -
 58
58 -
 59
59 -
 60
60 -
 61
61 -
 62
62 -
 63
63 -
 64
64 -
 65
65 -
 66
66 -
 67
67 -
 68
68 -
 69
69 -
 70
70 -
 71
71 -
72
-
73
-
74
-
75
-
76
-
77
-
78
-
79
-
80
-
81
-
82
-
83
-
84
-
85
-
86
-
87
-
88
-
89
-
90
-
91
-
92
-
93
-
94
-
95
-
96
-
97
-
98
-
99
-
100
-
101
-
102
-
103
-
104
-
105
-
106
-
107
-
108
-
109
-
110
-
111
-
112
-
113
-
114
-
115
-
116
-
117
-
118
-
119
-
120
-
121
-
122
-
123
-
124
-
125
-
126
-
127
-
128
-
129
-
130
 |
 |

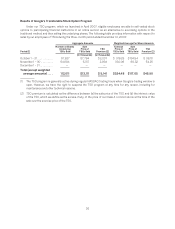
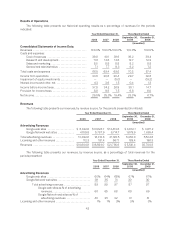
We believe that the increase in the number of paid clicks through our programs is substantially the result of
our commitment to improving the relevance and quality of both our search results and the advertisements
displayed, which we believe results in a better user experience, which in turn results in more searches, advertisers,
and Google Network members and other partners.
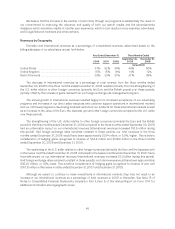
Revenues by Geography
Domestic and international revenues as a percentage of consolidated revenues, determined based on the
billing addresses of our advertisers, are set forth below.
Year Ended December 31, Three Months Ended
2006 2007 2008 September 30,
2008 December 31,
2008
(unaudited)
United States ........................................ 57% 52% 49% 49% 50%
United Kingdom ...................................... 15% 15% 14% 14% 12%
Rest of the world ..................................... 28% 33% 37% 37% 38%
The decrease in international revenues as a percentage of total revenue from the three months ended
September 30, 2008 to the three months ended December 31, 2008 resulted primarily from the strengthening of
the U.S. dollar relative to other foreign currencies (primarily the Euro and the British pound) over these periods,
partially offset by the increase in gains realized from our foreign exchange risk management program.
The annual growth in international revenues resulted largely from increased acceptance of our advertising
programs and increases in our direct sales resources and customer support operations in international markets
and our continued progress in developing localized versions of our products for these international markets as well
as an increase in the value of the Euro, the Japanese yen and other foreign currencies compared to the U.S. dollar
over these periods.
The strengthening of the U.S. dollar relative to other foreign currencies (primarily the Euro and the British
pound) in the three months ended December 31, 2008 compared to the three months ended September 30, 2008
had an unfavorable impact on our international revenues (international revenues increased $16.5 million during
this period). Had foreign exchange rates remained constant in these periods, our total revenues in the three
months ended December 31, 2008 would have been approximately $334 million, or 5.9%, higher. This is before
consideration of hedging gains recognized to revenue of $34.2 million and $128.9 million in the three months
ended September 30, 2008 and December 31, 2008.
The weakening of the U.S. dollar relative to other foreign currencies (primarily the Euro and the Japanese yen)
in the twelve months ended December 31, 2008 compared to the twelve months ended December 31, 2007 had a
favorable impact on our international revenues (international revenues increased $3.3 billion during this period).
Had foreign exchange rates remained constant in these periods, our total revenues would have been approximately
$353.5 million, or 1.6%, lower. This is before consideration of hedging gains recognized to revenue of zero and
$167.8 million in the twelve months ended December 31, 2007 and December 31, 2008.
Although we expect to continue to make investments in international markets, they may not result in an
increase in our international revenues as a percentage of total revenues in 2009 or thereafter. See Note 15 of
Notes to Consolidated Financial Statements included in Part II, Item 8 of this Annual Report on Form 10-K for
additional information about geographic areas.
45