Google 2008 Annual Report Download - page 59
Download and view the complete annual report
Please find page 59 of the 2008 Google annual report below. You can navigate through the pages in the report by either clicking on the pages listed below, or by using the keyword search tool below to find specific information within the annual report.-
 1
1 -
2
-
3
-
4
-
5
-
6
-
7
-
8
-
9
-
10
-
11
-
12
-
13
-
14
-
15
-
16
-
17
-
18
-
19
-
20
-
21
-
22
-
23
-
24
-
25
-
26
-
27
-
28
-
29
-
30
-
31
-
32
-
33
-
34
-
35
-
36
-
37
-
38
-
39
-
40
-
41
-
42
-
43
-
44
-
45
-
46
-
47
-
48
-
 49
49 -
 50
50 -
 51
51 -
 52
52 -
 53
53 -
 54
54 -
 55
55 -
 56
56 -
 57
57 -
 58
58 -
 59
59 -
 60
60 -
 61
61 -
 62
62 -
 63
63 -
 64
64 -
 65
65 -
 66
66 -
 67
67 -
 68
68 -
 69
69 -
70
-
71
-
72
-
73
-
74
-
75
-
76
-
77
-
78
-
79
-
80
-
81
-
82
-
83
-
84
-
85
-
86
-
87
-
88
-
89
-
90
-
91
-
92
-
93
-
94
-
95
-
96
-
97
-
98
-
99
-
100
-
101
-
102
-
103
-
104
-
105
-
106
-
107
-
108
-
109
-
110
-
111
-
112
-
113
-
114
-
115
-
116
-
117
-
118
-
119
-
120
-
121
-
122
-
123
-
124
-
125
-
126
-
127
-
128
-
129
-
130
 |
 |

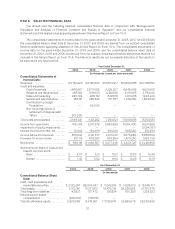
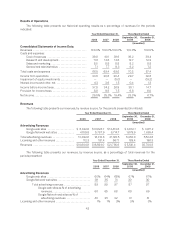
Results of Operations
The following table presents our historical operating results as a percentage of revenues for the periods
indicated:
Year Ended December 31, Three Months Ended
2006 2007 2008 September 30,
2008 December 31,
2008
(unaudited)
Consolidated Statements of Income Data:
Revenues ......................................... 100.0% 100.0% 100.0% 100.0% 100.0%
Costs and expenses:
Cost of revenues .............................. 39.8 40.1 39.6 39.2 38.4
Research and development ..................... 11.6 12.8 12.8 12.7 12.9
Sales and marketing ........................... 8.0 8.8 8.9 9.2 8.9
General and administrative ..................... 7.1 7.7 8.3 9.2 7.2
Total costs and expenses ........................... 66.5 69.4 69.6 70.3 67.4
Income from operations ............................ 33.5 30.6 30.4 29.7 32.6
Impairment of equity investments .................... — — (5.0) — (19.2)
Interest income and other, net ....................... 4.3 3.6 1.5 0.4 1.3
Income before income taxes ......................... 37.8 34.2 26.9 30.1 14.7
Provision for income taxes .......................... 8.8 8.9 7.5 6.8 8.0
Net income ........................................ 29.0% 25.3% 19.4% 23.3% 6.7%
Revenues
The following table presents our revenues, by revenue source, for the periods presented (in millions):
Year Ended December 31, Three Months Ended
2006 2007 2008 September 30,
2008 December 31,
2008
(unaudited)
Advertising Revenues
Google web sites .................... $ 6,332.8 $10,624.7 $ 14,413.8 $ 3,672.1 $ 3,811.2
Google Network web sites ............ 4,159.8 5,787.9 6,714.7 1,679.9 1,693.4
Total advertising revenues ................ 10,492.6 16,412.6 21,128.5 5,352.0 5,504.6
Licensing and other revenues .............. 112.3 181.4 667.1 189.4 196.3
Revenues ............................... $10,604.9 $16,594.0 $21,795.6 $ 5,541.4 $5,700.9
The following table presents our revenues, by revenue source, as a percentage of total revenues for the
periods presented:
Year Ended December 31, Three Months Ended
2006 2007 2008 September 30,
2008 December 31,
2008
(unaudited)
Advertising Revenues
Google web sites ................................. 60% 64% 66% 67% 67%
Google Network web sites ......................... 39 35 31 30 30
Total advertising revenues .................... 99 99 97 97 97
Google web sites as % of advertising
revenues ............................. 60 65 68 69 69
Google Network web sites as % of
advertising revenues .................. 40 35 32 31 31
Licensing and other revenues .......................... 1% 1% 3% 3% 3%
43