Google 2008 Annual Report Download - page 93
Download and view the complete annual report
Please find page 93 of the 2008 Google annual report below. You can navigate through the pages in the report by either clicking on the pages listed below, or by using the keyword search tool below to find specific information within the annual report.-
 1
1 -
2
-
3
-
4
-
5
-
6
-
7
-
8
-
9
-
10
-
11
-
12
-
13
-
14
-
15
-
16
-
17
-
18
-
19
-
20
-
21
-
22
-
23
-
24
-
25
-
26
-
27
-
28
-
29
-
30
-
31
-
32
-
33
-
34
-
35
-
36
-
37
-
38
-
39
-
40
-
41
-
42
-
43
-
44
-
45
-
46
-
47
-
48
-
49
-
50
-
51
-
52
-
53
-
54
-
55
-
56
-
57
-
58
-
59
-
60
-
61
-
62
-
63
-
64
-
65
-
66
-
67
-
68
-
69
-
70
-
71
-
72
-
73
-
74
-
75
-
76
-
77
-
78
-
79
-
80
-
81
-
82
-
 83
83 -
 84
84 -
 85
85 -
 86
86 -
 87
87 -
 88
88 -
 89
89 -
 90
90 -
 91
91 -
 92
92 -
 93
93 -
 94
94 -
 95
95 -
 96
96 -
 97
97 -
 98
98 -
 99
99 -
 100
100 -
 101
101 -
 102
102 -
 103
103 -
104
-
105
-
106
-
107
-
108
-
109
-
110
-
111
-
112
-
113
-
114
-
115
-
116
-
117
-
118
-
119
-
120
-
121
-
122
-
123
-
124
-
125
-
126
-
127
-
128
-
129
-
130
 |
 |

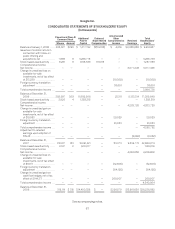
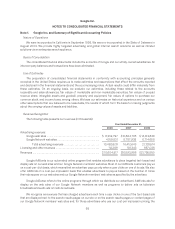
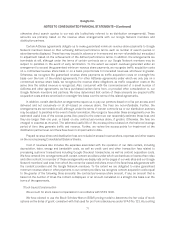
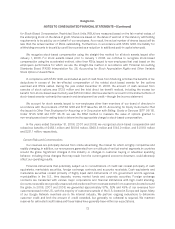
Google Inc.
NOTES TO CONSOLIDATED FINANCIAL STATEMENTS—(Continued)
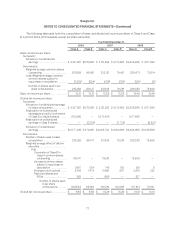
The following table sets forth the computation of basic and diluted net income per share of Class A and Class
B common stock (in thousands, except per share amounts):
Year Ended December 31,
2006 2007 2008
Class A Class B Class A Class B Class A Class B
Basic net income per share:
Numerator:
Allocation of undistributed
earnings ....................... $ 2,197,851 $879,595 $ 3,131,292 $ 1,072,428 $3,208,968 $ 1,017,890
Denominator:
Weighted average common shares
outstanding ................... 216,589 86,681 232,131 79,421 238,473 75,614
Less: Weighted average unvested
common shares subject to
repurchase or cancellation ...... (1,333) (534) (616) (130) (120) (8)
Number of shares used in per
share computations .......... 215,256 86,147 231,515 79,291 238,353 75,606
Basic net income per share ............. $ 10.21 $ 10.21 $ 13.53 $ 13.53 $ 13.46 $ 13.46
Diluted net income per share:
Numerator:
Allocation of undistributed earnings
for basic computation ........... $ 2,197,851 $879,595 $ 3,131,292 $ 1,072,428 $3,208,968 $ 1,017,890
Reallocation of undistributed
earnings as a result of conversion
of Class B to Class A shares ..... 879,595 — 1,072,428 — 1,017,890 —
Reallocation of undistributed
earnings to Class B shares ....... — (3,134) — (7,732) — (8,321)
Allocation of undistributed
earnings ....................... $3,077,446 $ 876,461 $4,203,720 $1,064,696 $4,226,858 $1,009,569
Denominator:
Number of shares used in basic
computation ................... 215,256 86,147 231,515 79,291 238,353 75,606
Weighted average effect of dilutive
securities ......................
Add:
Conversion of Class B to
Class A common shares
outstanding ............. 86,147 — 79,291 — 75,606 —
Unvested common shares
subject to repurchase or
cancellation ............. 1,867 534 746 130 128 8
Employee stock options .... 5,916 1,479 3,690 667 2,810 223
Restricted shares and
RSUs ................... 362 — 968 — 617 —
Number of shares used
in per share
computations ...... 309,548 88,160 316,210 80,088 317,514 75,837
Diluted net income per share ........... $ 9.94 $ 9.94 $ 13.29 $ 13.29 $ 13.31 $ 13.31
77