Google 2008 Annual Report Download - page 65
Download and view the complete annual report
Please find page 65 of the 2008 Google annual report below. You can navigate through the pages in the report by either clicking on the pages listed below, or by using the keyword search tool below to find specific information within the annual report.-
 1
1 -
2
-
3
-
4
-
5
-
6
-
7
-
8
-
9
-
10
-
11
-
12
-
13
-
14
-
15
-
16
-
17
-
18
-
19
-
20
-
21
-
22
-
23
-
24
-
25
-
26
-
27
-
28
-
29
-
30
-
31
-
32
-
33
-
34
-
35
-
36
-
37
-
38
-
39
-
40
-
41
-
42
-
43
-
44
-
45
-
46
-
47
-
48
-
49
-
50
-
51
-
52
-
53
-
54
-
 55
55 -
 56
56 -
 57
57 -
 58
58 -
 59
59 -
 60
60 -
 61
61 -
 62
62 -
 63
63 -
 64
64 -
 65
65 -
 66
66 -
 67
67 -
 68
68 -
 69
69 -
 70
70 -
 71
71 -
 72
72 -
 73
73 -
 74
74 -
 75
75 -
76
-
77
-
78
-
79
-
80
-
81
-
82
-
83
-
84
-
85
-
86
-
87
-
88
-
89
-
90
-
91
-
92
-
93
-
94
-
95
-
96
-
97
-
98
-
99
-
100
-
101
-
102
-
103
-
104
-
105
-
106
-
107
-
108
-
109
-
110
-
111
-
112
-
113
-
114
-
115
-
116
-
117
-
118
-
119
-
120
-
121
-
122
-
123
-
124
-
125
-
126
-
127
-
128
-
129
-
130
 |
 |

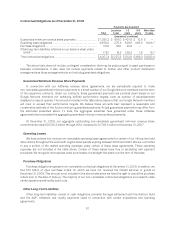
We expect that research and development expenses will continue to increase in dollar amount and may
increase as a percentage of revenues in 2009 and future periods because we expect to employ more research and
development personnel on average compared to prior periods and build the infrastructure required to support the
development of new, and improve existing, products and services.
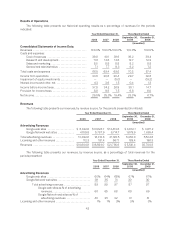
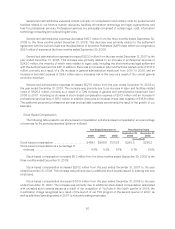
Sales and Marketing
The following table presents our sales and marketing expenses, and sales and marketing expenses as a
percentage of revenues for the periods presented (dollars in millions):
Year Ended December 31, Three Months Ended
2006 2007 2008 September 30,
2008 December 31,
2008
(unaudited)
Sales and marketing expenses ................... $849.5 $1,461.3 $1,946.2 $508.8 $506.0
Sales and marketing expenses as a percentage of
revenues ................................... 8.0% 8.8% 8.9% 9.2% 8.9%
Sales and marketing expenses consist primarily of compensation and related costs for personnel engaged in
customer service, sales, and sales support functions, as well as advertising and promotional expenditures.
Sales and marketing expenses decreased $2.8 million from the three months ended September 30, 2008 to
the three months ended December 31, 2008.
Sales and marketing expenses increased $484.9 million from the year ended December 31, 2007 to the year
ended December 31, 2008. This increase was primarily due to an increase in labor and facilities related costs of
$373.1 million mostly as a result of a 20% increase in sales and marketing headcount. In addition, there was an
increase in stock-based compensation expense of $74.4 million.
Sales and marketing expenses increased $611.8 million from the year ended December 31, 2006 to the year
ended December 31, 2007. This increase was primarily due to an increase in labor and facilities related costs of
$435.7 million mostly as a result of a 52% increase in sales and marketing headcount, including an increase in
stock-based compensation expense of $72.2 million, and an increase in depreciation and related expense of $74.2
million due to our increased capital expenditures. In addition, there was an increase in promotional and advertising
expense of $37.5 million and an increase in travel and entertainment expense of $28.9 million.
We anticipate that sales and marketing expenses may continue to increase in dollar amount and as a
percentage of revenues in 2009 and future periods as we continue to expand our business on a worldwide basis.
General and Administrative
The following table presents our general and administrative expenses, and general and administrative
expenses as a percentage of revenues for the periods presented (dollars in millions):
Year Ended December 31, Three Months Ended
2006 2007 2008 September 30,
2008 December 31,
2008
(unaudited)
General and administrative expenses ............. $751.8 $1,279.3 $1,802.6 $507.1 $411.4
General and administrative expenses as a
percentage of revenues ....................... 7.1% 7.7% 8.3% 9.2% 7.2%
49