Google 2008 Annual Report Download - page 108
Download and view the complete annual report
Please find page 108 of the 2008 Google annual report below. You can navigate through the pages in the report by either clicking on the pages listed below, or by using the keyword search tool below to find specific information within the annual report.-
 1
1 -
2
-
3
-
4
-
5
-
6
-
7
-
8
-
9
-
10
-
11
-
12
-
13
-
14
-
15
-
16
-
17
-
18
-
19
-
20
-
21
-
22
-
23
-
24
-
25
-
26
-
27
-
28
-
29
-
30
-
31
-
32
-
33
-
34
-
35
-
36
-
37
-
38
-
39
-
40
-
41
-
42
-
43
-
44
-
45
-
46
-
47
-
48
-
49
-
50
-
51
-
52
-
53
-
54
-
55
-
56
-
57
-
58
-
59
-
60
-
61
-
62
-
63
-
64
-
65
-
66
-
67
-
68
-
69
-
70
-
71
-
72
-
73
-
74
-
75
-
76
-
77
-
78
-
79
-
80
-
81
-
82
-
83
-
84
-
85
-
86
-
87
-
88
-
89
-
90
-
91
-
92
-
93
-
94
-
95
-
96
-
97
-
 98
98 -
 99
99 -
 100
100 -
 101
101 -
 102
102 -
 103
103 -
 104
104 -
 105
105 -
 106
106 -
 107
107 -
 108
108 -
 109
109 -
 110
110 -
 111
111 -
 112
112 -
 113
113 -
 114
114 -
 115
115 -
 116
116 -
 117
117 -
 118
118 -
119
-
120
-
121
-
122
-
123
-
124
-
125
-
126
-
127
-
128
-
129
-
130
 |
 |

Google Inc.
NOTES TO CONSOLIDATED FINANCIAL STATEMENTS—(Continued)
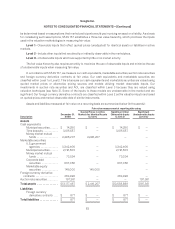
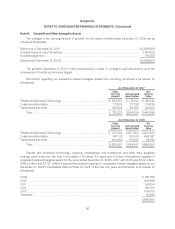
Options outstanding at December 31, 2007 and December 31, 2008 in the above tables include 360,679 and
26,068 options granted and exercised subsequent to March 21, 2002 that are unvested at December 31, 2007 and
2008, in accordance with EITF Issue No. 00-23, Issues Related to Accounting for Stock Compensation Under APB
Opinion No. 25 and FASB Interpretation No. 44. However, the computations of the weighted average exercise prices,
weighted average remaining contractual term and aggregate intrinsic value do not consider these unvested shares.
Further, the above tables include 1,529,512 warrants held by financial institutions that were options purchased from
employees under our TSO program.
The total grant date fair value of stock options vested during 2006, 2007 and 2008 was $392.9 million,
$635.1 million, and $692.5 million. The aggregate intrinsic value of all options exercised during 2006, 2007 and
2008 was $1,904.0 million, $1,279.0 million and $503.2 million. These amounts do not include the aggregate
sales price of options sold under our TSO program.
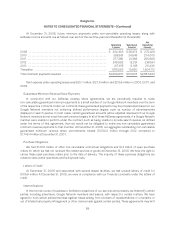
During 2008, the number of shares underlying TSOs sold to selected financial institutions under the TSO
program was 605,113 at a total value of $149.4 million, or an average of $246.90 per share, and an average
premium of $39.69 per share. The premium is calculated as the difference between (a) the sale price of the TSO
and (b) the intrinsic value of the TSO, which we define as the excess, if any, of the price of our Class A common
stock at the time of the sale over the exercise price of the TSO. At December 31, 2008, the number of options
eligible for participation under the TSO program was approximately 10.5 million.
As of December 31, 2008, there was $1,101.5 million of unrecognized compensation cost related to
outstanding employee stock options, net of forecasted forfeitures. This amount does not include the estimated
$400 million modification charge related to our employee stock option exchange (see Note 16). This amount is
expected to be recognized over a weighted average period of 2.8 years. To the extent the forfeiture rate is different
from what we have anticipated, stock-based compensation related to these awards will be different from our
expectations.
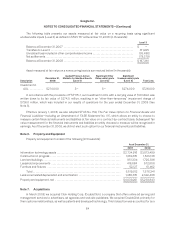
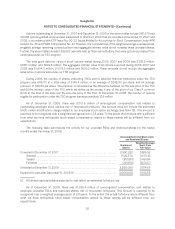
The following table summarizes the activity for our unvested RSUs and restricted shares for the twelve
months ended December 31, 2008:
Unvested Restricted Stock Units
and Restricted Shares
Number of
Shares
Weighted Average
Grant-Date
Fair Value
Unvested at December 31, 2007 ............................................ 2,990,222 $526.92
Granted ............................................................. 1,520,576 $473.43
Vested .............................................................. (951,551) $ 481.94
Forfeited ............................................................ (291,158) $520.07
Unvested at December 31, 2008 ........................................... 3,268,089 $ 514.56
Expected to vest after December 31, 2008 (1) ................................ 3,005,008 $ 514.56
(1) RSUs and restricted shares expected to vest reflect an estimated forfeiture rate.
As of December 31, 2008, there was $1,336.4 million of unrecognized compensation cost related to
employee unvested RSUs and restricted shares, net of forecasted forfeitures. This amount is expected to be
recognized over a weighted average period of 2.8 years. To the extent the actual forfeiture rate is different from
what we have anticipated, stock-based compensation related to these awards will be different from our
expectations.
92