Google 2008 Annual Report Download - page 57
Download and view the complete annual report
Please find page 57 of the 2008 Google annual report below. You can navigate through the pages in the report by either clicking on the pages listed below, or by using the keyword search tool below to find specific information within the annual report.-
 1
1 -
2
-
3
-
4
-
5
-
6
-
7
-
8
-
9
-
10
-
11
-
12
-
13
-
14
-
15
-
16
-
17
-
18
-
19
-
20
-
21
-
22
-
23
-
24
-
25
-
26
-
27
-
28
-
29
-
30
-
31
-
32
-
33
-
34
-
35
-
36
-
37
-
38
-
39
-
40
-
41
-
42
-
43
-
44
-
45
-
46
-
 47
47 -
 48
48 -
 49
49 -
 50
50 -
 51
51 -
 52
52 -
 53
53 -
 54
54 -
 55
55 -
 56
56 -
 57
57 -
 58
58 -
 59
59 -
 60
60 -
 61
61 -
 62
62 -
 63
63 -
 64
64 -
 65
65 -
 66
66 -
 67
67 -
68
-
69
-
70
-
71
-
72
-
73
-
74
-
75
-
76
-
77
-
78
-
79
-
80
-
81
-
82
-
83
-
84
-
85
-
86
-
87
-
88
-
89
-
90
-
91
-
92
-
93
-
94
-
95
-
96
-
97
-
98
-
99
-
100
-
101
-
102
-
103
-
104
-
105
-
106
-
107
-
108
-
109
-
110
-
111
-
112
-
113
-
114
-
115
-
116
-
117
-
118
-
119
-
120
-
121
-
122
-
123
-
124
-
125
-
126
-
127
-
128
-
129
-
130
 |
 |
• The number of searches initiated at our web sites and our Google Network members’ web sites and the
underlying purpose of these searches (for instance, whether they are for academic research, to find a
news article, or to find a product or service).
• The number and prominence of ads displayed on our web sites and our Google Network members’ web
sites.
• The number of visits to, and the content of, our Google Network members’ web sites and certain of our
web sites and the relevance and quality of the ads we display next to this content.
• The advertisers’ return on investment from advertising campaigns on our web sites or our Google
Network members’ web sites compared to other forms of advertising.
• The total advertising spending budgets of each advertiser.
• The number of advertisers and the breadth of items advertised.
• The amount we ultimately pay our Google Network members, distribution partners and our content
providers for traffic, access points and content compared to the amount of revenue we generate.
• Our minimum fee per click.
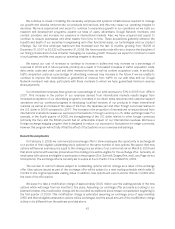
Trends in Our Business
Our business has grown rapidly since inception, resulting in substantially increased revenues, and we expect
that our business will continue to grow. However, our revenue growth rate has generally declined over time, and we
expect it will continue to do so as a result of a number of factors including increasing competition, the difficulty of
maintaining growth rates as our revenues increase to higher levels and increasing maturity of the online
advertising market in certain countries. In addition, the current general economic downturn may result in fewer
commercial queries by our users and may cause advertisers to reduce the amount they spend on online
advertising, which could negatively affect the growth rate of our revenues.
The main focus of our advertising programs is to provide relevant and useful advertising to our users,
reflecting our commitment to constantly improve their overall web experience. As a result, we expect to continue
to take steps to improve the relevance of the ads displayed on our web sites and our Google Network members’
web sites. These steps include not displaying ads that generate low click-through rates or that send users to
irrelevant or otherwise low quality sites and terminating our relationships with those Google Network members
whose web sites do not meet our quality requirements. We may also continue to take steps to reduce the number
of accidental clicks by our users. These steps could negatively affect the growth rate of our revenues.
Both seasonal fluctuations in internet usage and traditional retail seasonality have affected, and are likely to
continue to affect, our business. Internet usage generally slows during the summer months, and commercial
queries typically increase significantly in the fourth quarter of each year. These seasonal trends have caused and
will likely continue to cause, fluctuations in our quarterly results, including fluctuations in sequential revenue and
paid click growth rates.
The operating margin we realize on revenues generated from ads placed on our Google Network members’ web
sites through our AdSense program is significantly lower than the operating margin we realize from revenues
generated from ads placed on our web sites because most of the advertiser fees from ads served on Google Network
members’ web sites are shared with our Google Network members. For the past four years, growth in advertising
revenues from our web sites has exceeded that from our Google Network members’ web sites. This trend has had a
positive impact on our operating margins, and we expect that this will continue for the foreseeable future, although
the relative rate of growth in revenues from our web sites compared to the rate of growth in revenues from our
Google Network members’ web sites may vary over time.
41