Google 2008 Annual Report Download - page 70
Download and view the complete annual report
Please find page 70 of the 2008 Google annual report below. You can navigate through the pages in the report by either clicking on the pages listed below, or by using the keyword search tool below to find specific information within the annual report.-
 1
1 -
2
-
3
-
4
-
5
-
6
-
7
-
8
-
9
-
10
-
11
-
12
-
13
-
14
-
15
-
16
-
17
-
18
-
19
-
20
-
21
-
22
-
23
-
24
-
25
-
26
-
27
-
28
-
29
-
30
-
31
-
32
-
33
-
34
-
35
-
36
-
37
-
38
-
39
-
40
-
41
-
42
-
43
-
44
-
45
-
46
-
47
-
48
-
49
-
50
-
51
-
52
-
53
-
54
-
55
-
56
-
57
-
58
-
59
-
 60
60 -
 61
61 -
 62
62 -
 63
63 -
 64
64 -
 65
65 -
 66
66 -
 67
67 -
 68
68 -
 69
69 -
 70
70 -
 71
71 -
 72
72 -
 73
73 -
 74
74 -
 75
75 -
 76
76 -
 77
77 -
 78
78 -
 79
79 -
 80
80 -
81
-
82
-
83
-
84
-
85
-
86
-
87
-
88
-
89
-
90
-
91
-
92
-
93
-
94
-
95
-
96
-
97
-
98
-
99
-
100
-
101
-
102
-
103
-
104
-
105
-
106
-
107
-
108
-
109
-
110
-
111
-
112
-
113
-
114
-
115
-
116
-
117
-
118
-
119
-
120
-
121
-
122
-
123
-
124
-
125
-
126
-
127
-
128
-
129
-
130
 |
 |

The following table presents our unaudited quarterly results of operations as a percentage of revenues for the
eight quarters ended December 31, 2008.
Quarter Ended
Mar 31,
2007 Jun 30,
2007 Sep 30,
2007 Dec 31,
2007 Mar 31,
2008 Jun 30,
2008 Sep 30,
2008 Dec 31,
2008
Revenues ............................. 100.0% 100.0% 100.0% 100.0% 100.0% 100.0% 100.0% 100.0%
Costs and expenses:
Cost of revenues ...................... 40.1 40.3 39.3 40.5 40.7 40.0 39.2 38.4
Research and development ............. 11.1 13.7 13.0 13.1 13.0 12.7 12.7 12.9
Sales and marketing ................... 8.3 9.2 9.0 8.8 8.6 9.0 9.2 8.9
General and administrative .............. 7.2 8.2 7.6 7.8 7.9 8.9 9.2 7.2
Total costs and expenses ............... 66.7 71.4 68.9 70.2 70.2 70.6 70.3 67.4
Income from operations ................ 33.3 28.6 31.1 29.8 29.8 29.4 29.7 32.6
Impairment of equity investments ....... — — — — — — — (19.2)
Interest income and other, net ........... 3.6 3.5 3.6 3.5 3.2 1.1 0.4 1.3
Income before income taxes ............ 36.9 32.1 34.7 33.3 33.0 30.5 30.1 14.7
Provision for income taxes .............. 9.5 8.2 9.5 8.3 7.8 7.3 6.8 8.0
Net income ........................... 27.4% 23.9% 25.2% 25.0% 25.2% 23.2% 23.3% 6.7%
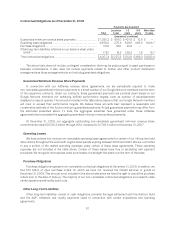
Liquidity and Capital Resources
In summary, our cash flows were:
Year Ended December 31,
2006 2007 2008
(in millions)
Net cash provided by operating activities ................................ $3,580.5 $ 5,775.4 $7,852.9
Net cash used in investing activities ..................................... (6,899.2) (3,681.6) (5,319.4)
Net cash provided by financing activities ................................ 2,966.4 403.1 87.6
At December 31, 2008 we had $15.8 billion of cash, cash equivalents and marketable securities. Cash
equivalents and marketable securities are comprised of highly liquid debt instruments of the U.S. government and
its agencies, municipalities in the U.S., time deposits, money market mutual funds and U.S. corporate securities.
Note 3 of Notes to Consolidated Financial Statements included in Item 8 of this Annual Report on Form 10-K
describes further the composition of our cash, cash equivalents and marketable securities.
Our principal sources of liquidity are our cash, cash equivalents and marketable securities, as well as the cash
flow that we generate from our operations. At December 31, 2007 and 2008, we had unused letters of credit for
approximately $20.4 million and $109.9 million. We believe that our existing cash, cash equivalents, marketable
securities and cash generated from operations will be sufficient to satisfy our currently anticipated cash
requirements through at least the next 12 months. Our liquidity could be negatively affected by a decrease in
demand for our products and services, including the impact of changes in customer buying or advertiser spending
behavior that may result from the current general economic downturn. Also, if the banking system or the financial
markets continue to deteriorate or remain volatile, our investment portfolio may be impacted and the values and
liquidity of our investments could be adversely affected. In addition, we may make acquisitions or license products
and technologies complementary to our business and may need to raise additional capital through future debt or
equity financing to provide for greater flexibility to fund any such acquisitions and licensing activities. Additional
financing may not be available at all or on terms favorable to us.
54