Google 2008 Annual Report Download - page 107
Download and view the complete annual report
Please find page 107 of the 2008 Google annual report below. You can navigate through the pages in the report by either clicking on the pages listed below, or by using the keyword search tool below to find specific information within the annual report.-
 1
1 -
2
-
3
-
4
-
5
-
6
-
7
-
8
-
9
-
10
-
11
-
12
-
13
-
14
-
15
-
16
-
17
-
18
-
19
-
20
-
21
-
22
-
23
-
24
-
25
-
26
-
27
-
28
-
29
-
30
-
31
-
32
-
33
-
34
-
35
-
36
-
37
-
38
-
39
-
40
-
41
-
42
-
43
-
44
-
45
-
46
-
47
-
48
-
49
-
50
-
51
-
52
-
53
-
54
-
55
-
56
-
57
-
58
-
59
-
60
-
61
-
62
-
63
-
64
-
65
-
66
-
67
-
68
-
69
-
70
-
71
-
72
-
73
-
74
-
75
-
76
-
77
-
78
-
79
-
80
-
81
-
82
-
83
-
84
-
85
-
86
-
87
-
88
-
89
-
90
-
91
-
92
-
93
-
94
-
95
-
96
-
 97
97 -
 98
98 -
 99
99 -
 100
100 -
 101
101 -
 102
102 -
 103
103 -
 104
104 -
 105
105 -
 106
106 -
 107
107 -
 108
108 -
 109
109 -
 110
110 -
 111
111 -
 112
112 -
 113
113 -
 114
114 -
 115
115 -
 116
116 -
 117
117 -
118
-
119
-
120
-
121
-
122
-
123
-
124
-
125
-
126
-
127
-
128
-
129
-
130
 |
 |

Google Inc.
NOTES TO CONSOLIDATED FINANCIAL STATEMENTS—(Continued)
employees. The risk-free interest rate for periods within the contractual life of the award is based on the U.S.
Treasury yield curve in effect at the time of grant.
The following table presents the weighted average assumptions used to estimate the fair values of the stock
options granted in the periods presented:
Year Ended December 31,
2006 2007 2008
Risk-free interest rate ......................................................................... 4.7% 4.4% 3.2%
Expected volatility ............................................................................ 34% 34% 35%
Expected life (in years) ........................................................................ 3.6 5.1 5.3
Dividend yield ................................................................................ — — —
Weighted average estimated fair value of options granted during the year ........................... $158.59 $213.56 $203.58
The following table summarizes the activity for our options for the twelve months ended December 31, 2008:
Options Outstanding
Number of
Shares
Weighted
Average
Exercise Price
Weighted
Average
Remaining
Contractual
Term
(in years)
Aggregate
Intrinsic
Value
(in millions) (1)
Balance at December 31, 2007 .................................. 12,892,886 $333.62
Options granted ........................................... 3,177,238 $500.07
Exercised (2) .............................................. (1,536,860) $ 58.66
Canceled/forfeited ........................................ (561,826) $ 450.19
Balance at December 31, 2008 .................................. 13,971,438 $ 391.40 7.0 $632.0
Vested and exercisable as of December 31, 2008 ............. 7,026,688 $295.02 6.7 $544.6
Vested and exercisable as of December 31, 2008 and expected
to vest thereafter (3) ..................................... 13,388,416 $ 387.33 7.0 $624.9
(1) The aggregate intrinsic value is calculated as the excess, if any, of the closing price of $307.65 of our Class A common stock on
December 31, 2008 over the exercise price of the underlying awards.
(2) Includes options vested during the period that were early exercised.
(3) Options expected to vest reflect an estimated forfeiture rate.
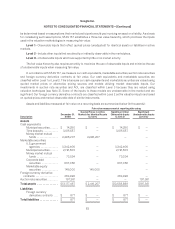
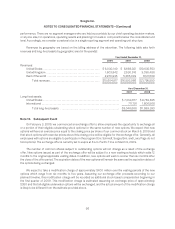
The following table summarizes additional information regarding outstanding, exercisable, and exercisable
and vested stock options at December 31, 2008:
Options Outstanding Options Exercisable Options Exercisable
and Vested
Range of Exercise
Prices
Total
Number of
Shares
Unvested
Options
Granted and
Exercised
Subsequent to
March 21,
2002 Number of
Shares
Weighted
Average
Remaining
Life
(in years)
Weighted
Average
Exercise
Price Number of
Shares
Weighted
Average
Exercise
Price Number of
Shares
Weighted
Average
Exercise
Price
$0.30 – $94.80 ...... 1,340,732 26,068 1,314,664 4.8 $ 19.69 1,244,880 $ 18.32 1,067,206 $ 19.65
$117.84 – $198.41 .... 1,576,111 — 1,576,111 4.2 $ 176.66 1,505,304 $ 176.11 1,503,441 $ 176.09
$205.96 –$298.91 . . . 1,370,309 — 1,370,309 5.2 $274.70 1,122,558 $273.70 1,121,722 $273.68
$300.97 – $399.00 . . 1,759,907 — 1,759,907 5.8 $329.97 1,255,409 $ 327.37 1,252,719 $ 327.32
$401.78 – $499.07 . . . 1,656,645 — 1,656,645 7.5 $450.82 738,304 $445.53 735,828 $444.56
$500.00 – $594.05 . . 6,016,466 — 6,016,466 8.7 $ 545.51 1,294,967 $ 546.19 1,290,628 $546.32
$615.95 – $699.35 . . . 200,564 — 200,564 8.9 $655.23 40,814 $ 662.13 40,814 $ 662.13
$707.00 – $732.94 . . 50,704 — 50,704 8.8 $ 718.20 14,330 $ 718.31 14,330 $ 718.31
$0.30 – $732.94 ..... 13,971,438 26,068 13,945,370 7.0 $ 391.40 7,216,566 $ 288.18 7,026,688 $295.02
91