GNC 2010 Annual Report Download - page 97
Download and view the complete annual report
Please find page 97 of the 2010 GNC annual report below. You can navigate through the pages in the report by either clicking on the pages listed below, or by using the keyword search tool below to find specific information within the annual report.-
 1
1 -
2
-
3
-
4
-
5
-
6
-
7
-
8
-
9
-
10
-
11
-
12
-
13
-
14
-
15
-
16
-
17
-
18
-
19
-
20
-
21
-
22
-
23
-
24
-
25
-
26
-
27
-
28
-
29
-
30
-
31
-
32
-
33
-
34
-
35
-
36
-
37
-
38
-
39
-
40
-
41
-
42
-
43
-
44
-
45
-
46
-
47
-
48
-
49
-
50
-
51
-
52
-
53
-
54
-
55
-
56
-
57
-
58
-
59
-
60
-
61
-
62
-
63
-
64
-
65
-
66
-
67
-
68
-
69
-
70
-
71
-
72
-
73
-
74
-
75
-
76
-
77
-
78
-
79
-
80
-
81
-
82
-
83
-
84
-
85
-
86
-
 87
87 -
 88
88 -
 89
89 -
 90
90 -
 91
91 -
 92
92 -
 93
93 -
 94
94 -
 95
95 -
 96
96 -
 97
97 -
 98
98 -
 99
99 -
 100
100 -
 101
101 -
 102
102 -
 103
103 -
 104
104 -
 105
105 -
 106
106 -
 107
107 -
108
-
109
-
110
-
111
-
112
-
113
-
114
-
115
-
116
-
117
-
118
-
119
-
120
-
121
-
122
-
123
-
124
-
125
-
126
-
127
-
128
-
129
-
130
-
131
-
132
-
133
-
134
-
135
-
136
-
137
-
138
-
139
-
140
-
141
-
142
-
143
-
144
-
145
-
146
-
147
-
148
-
149
-
150
-
151
-
152
-
153
-
154
-
155
-
156
-
157
-
158
-
159
-
160
-
161
-
162
-
163
-
164
-
165
-
166
-
167
-
168
-
169
-
170
-
171
-
172
-
173
-
174
-
175
-
176
-
177
-
178
-
179
-
180
-
181
-
182
-
183
-
184
-
185
-
186
-
187
-
188
-
189
-
190
-
191
-
192
-
193
-
194
-
195
-
196
-
197
-
198
-
199
-
200
-
201
-
202
-
203
-
204
-
205
-
206
-
207
-
208
-
209
-
210
-
211
-
212
-
213
-
214
-
215
-
216
-
217
-
218
-
219
-
220
-
221
-
222
-
223
-
224
-
225
-
226
-
227
-
228
-
229
-
230
-
231
-
232
-
233
-
234
-
235
-
236
-
237
-
238
-
239
-
240
 |
 |

Table of Contents
GENERAL NUTRITION CENTERS, INC. AND SUBSIDIARIES
NOTES TO THE CONSOLIDATED FINANCIAL STATEMENTS
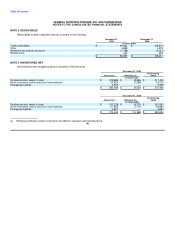
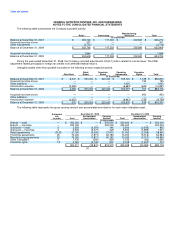
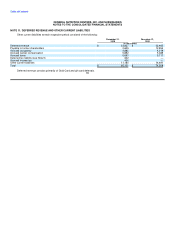
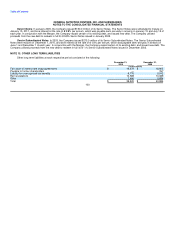
The following table summarizes the Company's goodwill activity:
Manufacturing/
Retail Franchising Wholesale Total
(in thousands)
Balance at December 31, 2007 $ 306,126 $ 117,303 $ 202,841 $ 626,270
Acquired franchise stores 351 — — 351
Other adjustments (3,712) — — (3,712)
Balance at December 31, 2008 $ 302,765 $ 117,303 $ 202,841 $ 622,909
Acquired franchise stores 1,844 — — 1,844
Balance at December 31, 2009 $ 304,609 $ 117,303 $ 202,841 $ 624,753
During the year ended December 31, 2008, the Company recorded adjustments of $(3.7) million related to income taxes. The 2008
adjustment relates principally to foreign tax credits from amended federal returns.
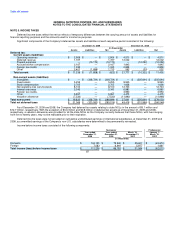
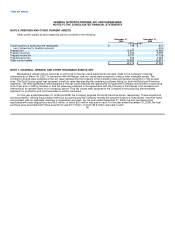
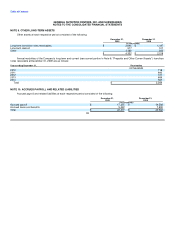
Intangible assets other than goodwill consisted of the following at each respective period:
Retail Franchise Operating Franchise
Gold Card Brand Brand Agreements Rights Total
(in thousands)
Balance at December 31, 2007 $ 6,041 $ 500,000 $ 220,000 $ 165,702 $ 1,129 $ 892,872
Acquired franchise stores — — — — 195 195
Other additions — — — 1,000 — 1,000
Amortization expense (3,585) — — (6,683) (623) (10,891)
Balance at December 31, 2008 $ 2,456 $ 500,000 $ 220,000 $ 160,019 $ 701 $ 883,176
Acquired franchise stores — — — — 953 953
Other additions — — — — — —
Amortization expense (2,081) — — (6,943) (735) (9,759)
Balance at December 31, 2009 $ 375 $ 500,000 $ 220,000 $ 153,076 $ 919 $ 874,370
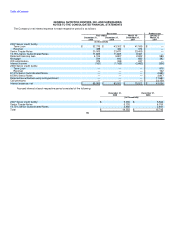
The following table represents the gross carrying amount and accumulated amortization for each major intangible asset:
Estimated December 31, 2009 December 31, 2008
Life Accumulated Carrying Accumulated Carrying
in years Cost Amortization Amount Cost Amortization Amount
(in thousands)
Brands — retail — $ 500,000 $ — $ 500,000 $ 500,000 $ — $ 500,000
Brands — franchise — 220,000 — 220,000 220,000 — 220,000
Gold card — retail 3 3,500 (3,354) 146 3,500 (2,545) 955
Gold card — franchise 3 5,500 (5,271) 229 5,500 (3,999) 1,501
Retail agreements 25-35 31,000 (3,090) 27,910 31,000 (2,038) 28,962
Franchise agreements 25 70,000 (7,817) 62,183 70,000 (5,016) 64,984
Manufacturing agreements 25 70,000 (7,817) 62,183 70,000 (5,017) 64,983
Other intangibles 5 1,150 (350) 800 1,150 (60) 1,090
Franchise rights 1-5 3,061 (2,142) 919 2,108 (1,407) 701
$ 904,211 $ (29,841) $ 874,370 $ 903,258 $ (20,082) $ 883,176
91