GNC 2010 Annual Report Download - page 47
Download and view the complete annual report
Please find page 47 of the 2010 GNC annual report below. You can navigate through the pages in the report by either clicking on the pages listed below, or by using the keyword search tool below to find specific information within the annual report.-
 1
1 -
2
-
3
-
4
-
5
-
6
-
7
-
8
-
9
-
10
-
11
-
12
-
13
-
14
-
15
-
16
-
17
-
18
-
19
-
20
-
21
-
22
-
23
-
24
-
25
-
26
-
27
-
28
-
29
-
30
-
31
-
32
-
33
-
34
-
35
-
36
-
 37
37 -
 38
38 -
 39
39 -
 40
40 -
 41
41 -
 42
42 -
 43
43 -
 44
44 -
 45
45 -
 46
46 -
 47
47 -
 48
48 -
 49
49 -
 50
50 -
 51
51 -
 52
52 -
 53
53 -
 54
54 -
 55
55 -
 56
56 -
 57
57 -
58
-
59
-
60
-
61
-
62
-
63
-
64
-
65
-
66
-
67
-
68
-
69
-
70
-
71
-
72
-
73
-
74
-
75
-
76
-
77
-
78
-
79
-
80
-
81
-
82
-
83
-
84
-
85
-
86
-
87
-
88
-
89
-
90
-
91
-
92
-
93
-
94
-
95
-
96
-
97
-
98
-
99
-
100
-
101
-
102
-
103
-
104
-
105
-
106
-
107
-
108
-
109
-
110
-
111
-
112
-
113
-
114
-
115
-
116
-
117
-
118
-
119
-
120
-
121
-
122
-
123
-
124
-
125
-
126
-
127
-
128
-
129
-
130
-
131
-
132
-
133
-
134
-
135
-
136
-
137
-
138
-
139
-
140
-
141
-
142
-
143
-
144
-
145
-
146
-
147
-
148
-
149
-
150
-
151
-
152
-
153
-
154
-
155
-
156
-
157
-
158
-
159
-
160
-
161
-
162
-
163
-
164
-
165
-
166
-
167
-
168
-
169
-
170
-
171
-
172
-
173
-
174
-
175
-
176
-
177
-
178
-
179
-
180
-
181
-
182
-
183
-
184
-
185
-
186
-
187
-
188
-
189
-
190
-
191
-
192
-
193
-
194
-
195
-
196
-
197
-
198
-
199
-
200
-
201
-
202
-
203
-
204
-
205
-
206
-
207
-
208
-
209
-
210
-
211
-
212
-
213
-
214
-
215
-
216
-
217
-
218
-
219
-
220
-
221
-
222
-
223
-
224
-
225
-
226
-
227
-
228
-
229
-
230
-
231
-
232
-
233
-
234
-
235
-
236
-
237
-
238
-
239
-
240
 |
 |

Table of Contents
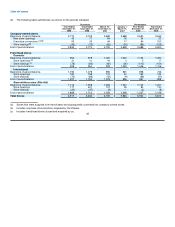
Successor Predecessor
Year Ended Year Ended March 16- January 1- Year Ended Year Ended
December 31, December 31, December 31, March 15, December 31, December 31,
(dollars in millions) 2009 2008 2007 2007 2006 2005
Balance Sheet Data:
Cash and cash equivalents $ 75.1 $ 42.3 $ 28.9 $ 9.5 $ 24.1 $ 86.0
Working capital (2) 382.6 305.1 258.1 233.6 249.5 298.7
Total assets 2,303.6 2,292.0 2,239.6 974.1 968.8 1,025.6
Total current and non-current long-term debt 1,059.8 1,084.7 1,087.0 10.7 431.4 473.4
Stockholder's equity 717.5 652.1 608.7 680.8 312.3 340.9
Other Data:
Net cash provided by (used in) operating activities 114.0 77.4 92.0 (50.9) 73.6 65.1
Net cash used in investing activities (42.2) (60.4) (1,671.4) (6.2) (23.4) (21.5)
Net cash (used in) provided by financing activities (39.3) (3.4) 1,598.7 42.8 (112.2) (42.6)
Capital expenditures $ 28.7 $ 48.7 $ 28.9 $ 5.7 $ 23.8 $ 20.8
Number of stores (at end of period):
Company-owned stores (3) 2,832 2,774 2,745 2,699 2,688 2,650
Franchised stores (3) 2,216 2,144 2,056 2,018 2,007 2,014
Franchised store-within-a-store locations (3) 1,869 1,712 1,358 1,266 1,227 1,149
(2) Working capital represents current assets less current liabilities. 41