GNC 2010 Annual Report Download - page 53
Download and view the complete annual report
Please find page 53 of the 2010 GNC annual report below. You can navigate through the pages in the report by either clicking on the pages listed below, or by using the keyword search tool below to find specific information within the annual report.-
 1
1 -
2
-
3
-
4
-
5
-
6
-
7
-
8
-
9
-
10
-
11
-
12
-
13
-
14
-
15
-
16
-
17
-
18
-
19
-
20
-
21
-
22
-
23
-
24
-
25
-
26
-
27
-
28
-
29
-
30
-
31
-
32
-
33
-
34
-
35
-
36
-
37
-
38
-
39
-
40
-
41
-
42
-
 43
43 -
 44
44 -
 45
45 -
 46
46 -
 47
47 -
 48
48 -
 49
49 -
 50
50 -
 51
51 -
 52
52 -
 53
53 -
 54
54 -
 55
55 -
 56
56 -
 57
57 -
 58
58 -
 59
59 -
 60
60 -
 61
61 -
 62
62 -
 63
63 -
64
-
65
-
66
-
67
-
68
-
69
-
70
-
71
-
72
-
73
-
74
-
75
-
76
-
77
-
78
-
79
-
80
-
81
-
82
-
83
-
84
-
85
-
86
-
87
-
88
-
89
-
90
-
91
-
92
-
93
-
94
-
95
-
96
-
97
-
98
-
99
-
100
-
101
-
102
-
103
-
104
-
105
-
106
-
107
-
108
-
109
-
110
-
111
-
112
-
113
-
114
-
115
-
116
-
117
-
118
-
119
-
120
-
121
-
122
-
123
-
124
-
125
-
126
-
127
-
128
-
129
-
130
-
131
-
132
-
133
-
134
-
135
-
136
-
137
-
138
-
139
-
140
-
141
-
142
-
143
-
144
-
145
-
146
-
147
-
148
-
149
-
150
-
151
-
152
-
153
-
154
-
155
-
156
-
157
-
158
-
159
-
160
-
161
-
162
-
163
-
164
-
165
-
166
-
167
-
168
-
169
-
170
-
171
-
172
-
173
-
174
-
175
-
176
-
177
-
178
-
179
-
180
-
181
-
182
-
183
-
184
-
185
-
186
-
187
-
188
-
189
-
190
-
191
-
192
-
193
-
194
-
195
-
196
-
197
-
198
-
199
-
200
-
201
-
202
-
203
-
204
-
205
-
206
-
207
-
208
-
209
-
210
-
211
-
212
-
213
-
214
-
215
-
216
-
217
-
218
-
219
-
220
-
221
-
222
-
223
-
224
-
225
-
226
-
227
-
228
-
229
-
230
-
231
-
232
-
233
-
234
-
235
-
236
-
237
-
238
-
239
-
240
 |
 |

Table of Contents
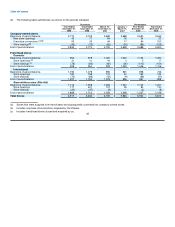
As discussed in the "Segment" note to our consolidated financial statements, we evaluate segment operating results based on several
indicators. The primary key performance indicators are revenues and operating income or loss for each segment. Revenues and operating
income or loss, as evaluated by management, exclude certain items that are managed at the consolidated level, such as warehousing and
transportation costs, impairments, and other corporate costs. The following discussion compares the revenues and the operating income or loss
by segment, as well as those items excluded from the segment totals.
Same store sales growth reflects the percentage change in same store sales in the period presented compared to the prior year period.
Same store sales are calculated on a daily basis for each store and exclude the net sales of a store for any period if the store was not open
during the same period of the prior year. Beginning in the first quarter of 2006, we also included our internet sales, as generated through
www.gnc.com and www.drugstore.com, in our domestic company-owned same store sales calculation. When a store's square footage has
been changed as a result of reconfiguration or relocation in the same mall or shopping center, the store continues to be treated as a same
store. If, during the period presented, a store was closed, relocated to a different mall or shopping center, or converted to a franchised store or
a company-owned store, sales from that store up to and including the closing day or the day immediately preceding the relocation or conversion
are included as same store sales as long as the store was open during the same period of the prior year. We exclude from the calculation sales
during the period presented from the date of relocation to a different mall or shopping center and from the date of a conversion. In the second
quarter of 2006, we modified the calculation method for domestic franchised same store sales consistent with this description, which has been
the method historically used for domestic company-owned same store sales.
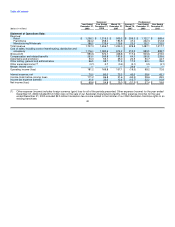
Results of Operations
(Dollars in millions and percentages expressed as a percentage of total net revenues)
Successor Predecessor
Year Ended December 31, Year Ended December 31, March 16 - December 31, January 1 - March 15,
2009 2008 2007 2007
Revenues:
Retail $ 1,256.3 73.6% $ 1,219.3 73.6% $ 909.3 74.3% $ 259.3 78.6%
Franchise 264.2 15.5% 258.0 15.6% 193.9 15.9% 47.2 14.3%
Manufacturing / Wholesale 186.5 10.9% 179.4 10.8% 119.8 9.8% 23.3 7.1%
Total net revenues 1,707.0 100.0% 1,656.7 100.0% 1,223.0 100.0% 329.8 100.0%
Operating expenses:
Cost of sales, including warehousing,
distribution and occupancy costs 1,116.4 65.4% 1,082.6 65.3% 814.2 66.5% 212.2 64.4%
Compensation and related benefits 263.0 15.4% 249.8 15.1% 195.8 16.0% 64.3 19.5%
Advertising and promotion 50.0 2.9% 55.1 3.3% 35.0 2.9% 20.5 6.2%
Other selling, general and administrative
expenses 86.7 5.1% 87.8 5.3% 62.1 5.1% 16.5 5.0%
Amortization expense 9.8 0.6% 10.9 0.7% 9.2 0.7% 0.8 0.2%
Foreign currency loss (gain) (0.1) 0.0% 0.7 0.0% (0.4) 0.0% (0.1) 0.0%
Transaction related costs — 0.0% — 0.0% — 0.0% 34.6 10.5%
Total operating expenses 1,525.8 89.4% 1,486.9 89.7% 1,115.9 91.2% 348.8 105.8%
Operating income:
Retail 153.1 9.0% 140.9 8.5% 106.5 8.8% 28.2 8.6%
Franchise 80.8 4.7% 80.8 4.9% 55.0 4.5% 14.5 4.4%
Manufacturing / Wholesale 73.5 4.3% 67.4 4.1% 38.9 3.2% 10.3 3.1%
Unallocated corporate and other costs:
Warehousing and distribution costs (53.6) -3.1% (54.2) -3.3% (40.7) -3.3% (10.7) -3.2%
Corporate costs (72.6) -4.3% (65.1) -3.9% (52.6) -4.4% (26.7) -8.2%
Merger related costs — 0.0% — 0.0% — 0.0% (34.6) -10.5%
Subtotal unallocated corporate and other
costs, net (126.2) -7.4% (119.3) -7.2% (93.3) -7.7% (72.0) -21.9%
Total operating income (loss) 181.2 10.6% 169.8 10.3% 107.1 8.8% (19.0) -5.8%
Interest expense, net 70.0 83.0 75.5 43.0
Income (loss) before income taxes 111.2 86.8 31.6 (62.0)
Income tax expense (benefit) 41.6 32.0 12.6 (10.7)
Net income (loss) $ 69.6 $ 54.8 $ 19.0 $ (51.3)
Note: The numbers in the above table have been rounded to millions. All calculations related to the Results of Operations for the year-
over-year comparisons below were derived from unrounded data and could occasionally differ immaterially if you were to use the table above
for these calculations. 47