GNC 2010 Annual Report Download - page 96
Download and view the complete annual report
Please find page 96 of the 2010 GNC annual report below. You can navigate through the pages in the report by either clicking on the pages listed below, or by using the keyword search tool below to find specific information within the annual report.-
 1
1 -
2
-
3
-
4
-
5
-
6
-
7
-
8
-
9
-
10
-
11
-
12
-
13
-
14
-
15
-
16
-
17
-
18
-
19
-
20
-
21
-
22
-
23
-
24
-
25
-
26
-
27
-
28
-
29
-
30
-
31
-
32
-
33
-
34
-
35
-
36
-
37
-
38
-
39
-
40
-
41
-
42
-
43
-
44
-
45
-
46
-
47
-
48
-
49
-
50
-
51
-
52
-
53
-
54
-
55
-
56
-
57
-
58
-
59
-
60
-
61
-
62
-
63
-
64
-
65
-
66
-
67
-
68
-
69
-
70
-
71
-
72
-
73
-
74
-
75
-
76
-
77
-
78
-
79
-
80
-
81
-
82
-
83
-
84
-
85
-
 86
86 -
 87
87 -
 88
88 -
 89
89 -
 90
90 -
 91
91 -
 92
92 -
 93
93 -
 94
94 -
 95
95 -
 96
96 -
 97
97 -
 98
98 -
 99
99 -
 100
100 -
 101
101 -
 102
102 -
 103
103 -
 104
104 -
 105
105 -
 106
106 -
107
-
108
-
109
-
110
-
111
-
112
-
113
-
114
-
115
-
116
-
117
-
118
-
119
-
120
-
121
-
122
-
123
-
124
-
125
-
126
-
127
-
128
-
129
-
130
-
131
-
132
-
133
-
134
-
135
-
136
-
137
-
138
-
139
-
140
-
141
-
142
-
143
-
144
-
145
-
146
-
147
-
148
-
149
-
150
-
151
-
152
-
153
-
154
-
155
-
156
-
157
-
158
-
159
-
160
-
161
-
162
-
163
-
164
-
165
-
166
-
167
-
168
-
169
-
170
-
171
-
172
-
173
-
174
-
175
-
176
-
177
-
178
-
179
-
180
-
181
-
182
-
183
-
184
-
185
-
186
-
187
-
188
-
189
-
190
-
191
-
192
-
193
-
194
-
195
-
196
-
197
-
198
-
199
-
200
-
201
-
202
-
203
-
204
-
205
-
206
-
207
-
208
-
209
-
210
-
211
-
212
-
213
-
214
-
215
-
216
-
217
-
218
-
219
-
220
-
221
-
222
-
223
-
224
-
225
-
226
-
227
-
228
-
229
-
230
-
231
-
232
-
233
-
234
-
235
-
236
-
237
-
238
-
239
-
240
 |
 |
Table of Contents
GENERAL NUTRITION CENTERS, INC. AND SUBSIDIARIES
NOTES TO THE CONSOLIDATED FINANCIAL STATEMENTS
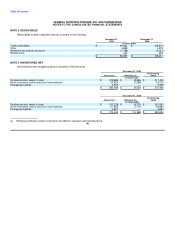
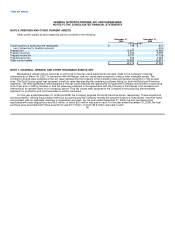
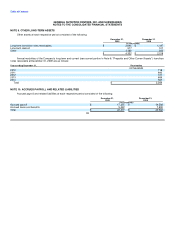
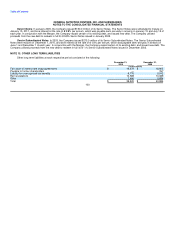
NOTE 6. PREPAIDS AND OTHER CURRENT ASSETS
Other current assets at each respective period consisted of the following:
December 31, December 31,
2009 2008
(in thousands)
Current portion of franchise note receivables $ 718 $ 871
Less: allowance for doubtful accounts — (240)
Prepaid rent 13,397 12,992
Prepaid insurance 4,452 5,590
Prepaid income tax 9,737 11,138
Prepaid payroll tax 923 3,684
Other current assets 12,992 13,917
$ 42,219 $ 47,952
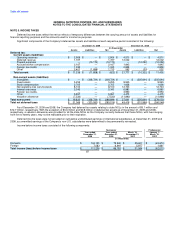
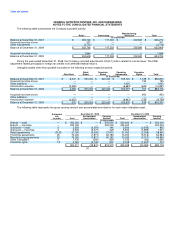
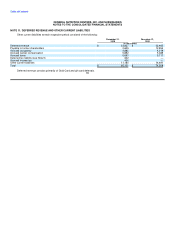
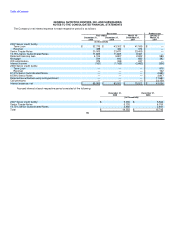
NOTE 7. GOODWILL, BRANDS, AND OTHER INTANGIBLE ASSETS, NET
Management utilized various resources in arriving at its final fair value adjustments that were made to the Company's financial
statements as of March 16, 2007. In connection with the Merger, final fair values were assigned to various other intangible assets. The
Company's brands were assigned a final fair value representing the longevity of the Company name and general recognition of the product
lines. The Gold Card program was assigned a final fair value representing the underlying customer listing, for both the Retail and Franchise
segments. The retail agreements were assigned a final fair value reflecting the opportunity to expand the Company stores within a major drug
store chain and on military facilities. A final fair value was assigned to the agreements with the Company's franchisees, both domestic and
international, to operate stores for a contractual period. Final fair values were assigned to the Company's manufacturing and wholesale
segments for production and continued sales to certain customers.
For the year ended December 31, 2009 and 2008, the Company acquired 53 and 33 franchise stores, respectively. These acquisitions
are accounted for utilizing the purchase method of accounting and the Company records the acquired inventory, fixed assets, franchise rights
and goodwill, with an applicable reduction to receivables and cash. For the year ended December 31, 2009, the total purchase prices
associated with these acquisitions was $9.3 million, of which $2.5 million was paid in cash. For the year ended December 31, 2008, the total
purchase price associated with these acquisitions was $1.7 million, of which $0.3 million was paid in cash.
90