GNC 2010 Annual Report Download - page 123
Download and view the complete annual report
Please find page 123 of the 2010 GNC annual report below. You can navigate through the pages in the report by either clicking on the pages listed below, or by using the keyword search tool below to find specific information within the annual report.-
 1
1 -
2
-
3
-
4
-
5
-
6
-
7
-
8
-
9
-
10
-
11
-
12
-
13
-
14
-
15
-
16
-
17
-
18
-
19
-
20
-
21
-
22
-
23
-
24
-
25
-
26
-
27
-
28
-
29
-
30
-
31
-
32
-
33
-
34
-
35
-
36
-
37
-
38
-
39
-
40
-
41
-
42
-
43
-
44
-
45
-
46
-
47
-
48
-
49
-
50
-
51
-
52
-
53
-
54
-
55
-
56
-
57
-
58
-
59
-
60
-
61
-
62
-
63
-
64
-
65
-
66
-
67
-
68
-
69
-
70
-
71
-
72
-
73
-
74
-
75
-
76
-
77
-
78
-
79
-
80
-
81
-
82
-
83
-
84
-
85
-
86
-
87
-
88
-
89
-
90
-
91
-
92
-
93
-
94
-
95
-
96
-
97
-
98
-
99
-
100
-
101
-
102
-
103
-
104
-
105
-
106
-
107
-
108
-
109
-
110
-
111
-
112
-
 113
113 -
 114
114 -
 115
115 -
 116
116 -
 117
117 -
 118
118 -
 119
119 -
 120
120 -
 121
121 -
 122
122 -
 123
123 -
 124
124 -
 125
125 -
 126
126 -
 127
127 -
 128
128 -
 129
129 -
 130
130 -
 131
131 -
 132
132 -
 133
133 -
134
-
135
-
136
-
137
-
138
-
139
-
140
-
141
-
142
-
143
-
144
-
145
-
146
-
147
-
148
-
149
-
150
-
151
-
152
-
153
-
154
-
155
-
156
-
157
-
158
-
159
-
160
-
161
-
162
-
163
-
164
-
165
-
166
-
167
-
168
-
169
-
170
-
171
-
172
-
173
-
174
-
175
-
176
-
177
-
178
-
179
-
180
-
181
-
182
-
183
-
184
-
185
-
186
-
187
-
188
-
189
-
190
-
191
-
192
-
193
-
194
-
195
-
196
-
197
-
198
-
199
-
200
-
201
-
202
-
203
-
204
-
205
-
206
-
207
-
208
-
209
-
210
-
211
-
212
-
213
-
214
-
215
-
216
-
217
-
218
-
219
-
220
-
221
-
222
-
223
-
224
-
225
-
226
-
227
-
228
-
229
-
230
-
231
-
232
-
233
-
234
-
235
-
236
-
237
-
238
-
239
-
240
 |
 |

Table of Contents
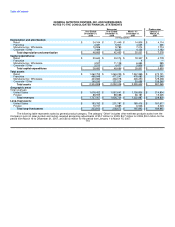
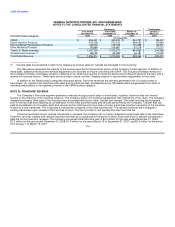
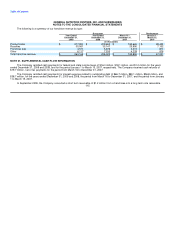
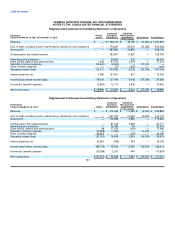
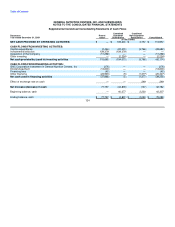
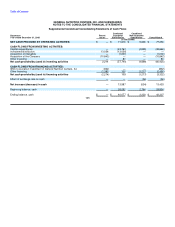
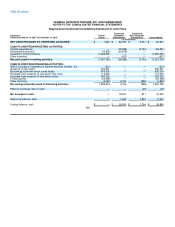
GENERAL NUTRITION CENTERS, INC. AND SUBSIDIARIES
NOTES TO THE CONSOLIDATED FINANCIAL STATEMENTS
Level 1 — observable inputs such as quoted prices in active markets for identical assets and liabilities;
Level 2 — observable inputs such as quoted prices for similar assets or liabilities in active markets, quoted prices for identical or similar
assets or liabilities in markets that are not active, other inputs that are observable, or can be corroborated by observable market
data; and
Level 3 — unobservable inputs for which there are little or no market data, which require the reporting entity to develop its own
assumptions.
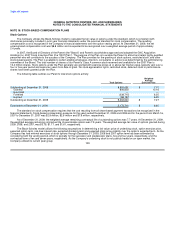
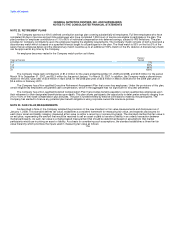
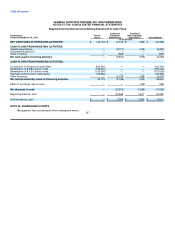
The following table presents our financial assets and liabilities that were accounted for at fair value on a recurring basis as of
December 31, 2009 by level within the fair value hierarchy:
Fair Value Measurements Using
Level 1 Level 2 Level 3
(in thousands)
Other long-term liabilities $ 2,337 $ 14,679 $ —
The following is a description of the valuation methodologies used for these items, as well as the general classification of such items
pursuant to the fair value hierarchy of the standard on Fair Value Measurements and Disclosures:
Other long-term liabilities — Other long-term liabilities classified as Level 1 consist of liabilities related to the Company's non-qualified
deferred compensation plan. The liabilities related to these plans are adjusted based on changes in the fair value of the underlying employee-
directed investment choices. Since the employee-directed investment choices are exchange traded equity indexes with quoted prices in active
markets, the liabilities are classified as within Level 1 on the fair value hierarchy. Other long-term liabilities classified as Level 2 consist of the
Company's interest rate swaps. The derivatives are a pay-variable, receive-fixed interest rate swap based on a LIBOR rate. Fair value is based
on a model-derived valuation using the LIBOR rate, which is an observable input in an active market. Therefore, the Company's derivative is
classified as Level 2 on the fair value hierarchy.
In addition to the above table, the Company's financial instruments also consist of cash and cash equivalents, accounts receivable,
accounts payable and long-term debt. The Company did not elect to value its long-term debt with the fair value option in accordance with the
standard on Financial Instruments. The Company believes that the recorded values of all of its other financial instruments approximate their fair
values because of their nature and respective durations.
NOTE 24. RELATED PARTY TRANSACTIONS
Successor:
Management Services Agreement. Upon consummation of the Merger, the Company entered into a services agreement with its ultimate
Parent, GNC Acquisition Holdings Inc ("Holdings"). Under the agreement, Holdings agreed to provide the Company and its subsidiaries with
certain services in exchange for an annual fee of $1.5 million, as well as customary fees for services rendered in connection with certain major
financial transactions, plus reimbursement of expenses and a tax gross-up relating to a non-tax deductible portion of the fee. The company
agreed to provide customary indemnifications to Holdings and its affiliates and those providing services on its behalf. In addition, upon
consummation of the Merger, the Company incurred an aggregate fee of $10.0 million, plus reimbursement of expenses, payable to Holdings
for services rendered in connection with the Merger. As of December 31, 2009, $4.2 million had been paid pursuant to this agreement.
117