GNC 2010 Annual Report Download - page 126
Download and view the complete annual report
Please find page 126 of the 2010 GNC annual report below. You can navigate through the pages in the report by either clicking on the pages listed below, or by using the keyword search tool below to find specific information within the annual report.-
 1
1 -
2
-
3
-
4
-
5
-
6
-
7
-
8
-
9
-
10
-
11
-
12
-
13
-
14
-
15
-
16
-
17
-
18
-
19
-
20
-
21
-
22
-
23
-
24
-
25
-
26
-
27
-
28
-
29
-
30
-
31
-
32
-
33
-
34
-
35
-
36
-
37
-
38
-
39
-
40
-
41
-
42
-
43
-
44
-
45
-
46
-
47
-
48
-
49
-
50
-
51
-
52
-
53
-
54
-
55
-
56
-
57
-
58
-
59
-
60
-
61
-
62
-
63
-
64
-
65
-
66
-
67
-
68
-
69
-
70
-
71
-
72
-
73
-
74
-
75
-
76
-
77
-
78
-
79
-
80
-
81
-
82
-
83
-
84
-
85
-
86
-
87
-
88
-
89
-
90
-
91
-
92
-
93
-
94
-
95
-
96
-
97
-
98
-
99
-
100
-
101
-
102
-
103
-
104
-
105
-
106
-
107
-
108
-
109
-
110
-
111
-
112
-
113
-
114
-
115
-
 116
116 -
 117
117 -
 118
118 -
 119
119 -
 120
120 -
 121
121 -
 122
122 -
 123
123 -
 124
124 -
 125
125 -
 126
126 -
 127
127 -
 128
128 -
 129
129 -
 130
130 -
 131
131 -
 132
132 -
 133
133 -
 134
134 -
 135
135 -
 136
136 -
137
-
138
-
139
-
140
-
141
-
142
-
143
-
144
-
145
-
146
-
147
-
148
-
149
-
150
-
151
-
152
-
153
-
154
-
155
-
156
-
157
-
158
-
159
-
160
-
161
-
162
-
163
-
164
-
165
-
166
-
167
-
168
-
169
-
170
-
171
-
172
-
173
-
174
-
175
-
176
-
177
-
178
-
179
-
180
-
181
-
182
-
183
-
184
-
185
-
186
-
187
-
188
-
189
-
190
-
191
-
192
-
193
-
194
-
195
-
196
-
197
-
198
-
199
-
200
-
201
-
202
-
203
-
204
-
205
-
206
-
207
-
208
-
209
-
210
-
211
-
212
-
213
-
214
-
215
-
216
-
217
-
218
-
219
-
220
-
221
-
222
-
223
-
224
-
225
-
226
-
227
-
228
-
229
-
230
-
231
-
232
-
233
-
234
-
235
-
236
-
237
-
238
-
239
-
240
 |
 |
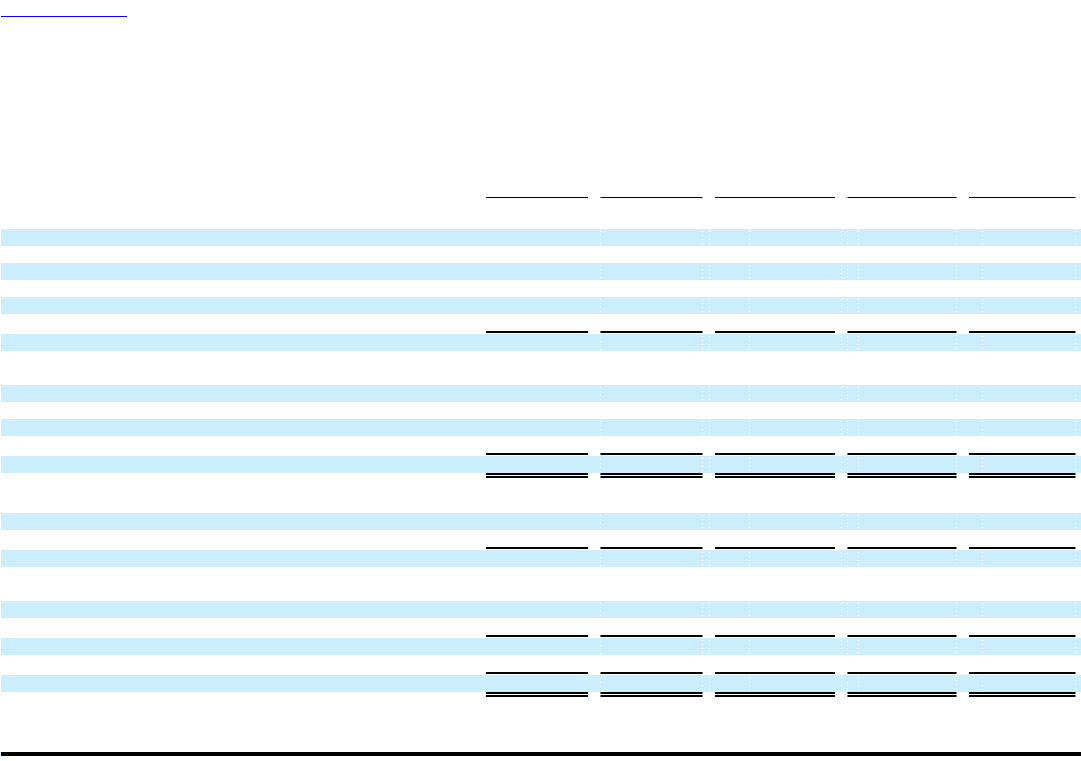
Table of Contents
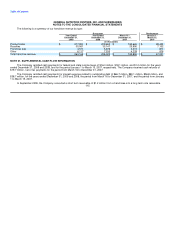
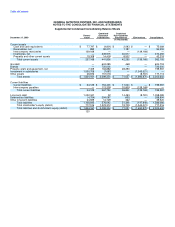
GENERAL NUTRITION CENTERS, INC. AND SUBSIDIARIES
NOTES TO THE CONSOLIDATED FINANCIAL STATEMENTS
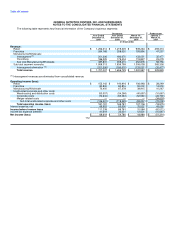
Supplemental Condensed Consolidating Balance Sheets
Combined Combined
Parent/ Guarantor Non-Guarantor
December 31, 2009 Issuer Subsidiaries Subsidiaries Eliminations Consolidated
(in thousands)
Current assets
Cash and cash equivalents $ 77,797 $ (4,801) $ 2,093 $ — $ 75,089
Receivables, net 895 92,273 1,187 — 94,355
Intercompany receivables 139,168 — — (139,168) —
Inventories, net — 339,975 30,517 — 370,492
Prepaids and other current assets 19,308 14,409 8,502 — 42,219
Total current assets 237,168 441,856 42,299 (139,168) 582,155
Goodwill — 624,285 468 — 624,753
Brands — 720,000 — — 720,000
Property, plant and equipment, net 7,409 163,882 28,290 — 199,581
Investment in subsidiaries 1,550,708 (7,687) — (1,543,021) —
Other assets 28,876 157,018 — (8,781) 177,113
Total assets $ 1,824,161 $ 2,099,354 $ 71,057 $ (1,690,970) $ 2,303,602
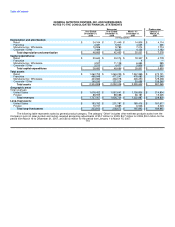
Current liabilities
Current liabilities $ 34,129 $ 154,435 $ 11,023 $ — $ 199,587
Intercompany payables — 113,359 25,809 (139,168) —
Total current liabilities 34,129 267,794 36,832 (139,168) 199,587
Long-term debt 1,052,341 32 14,493 (8,781) 1,058,085
Deferred tax liabilities (4,754) 294,087 (439) — 288,894
Other long-term liabilities 24,929 14,129 462 — 39,520
Total liabilities 1,106,645 576,042 51,348 (147,949) 1,586,086
Total stockholder's equity (deficit) 717,516 1,523,312 19,709 (1,543,021) 717,516
Total liabilities and stockholder's equity (deficit) $ 1,824,161 $ 2,099,354 $ 71,057 $ (1,690,970) $ 2,303,602
120