GNC 2010 Annual Report Download - page 58
Download and view the complete annual report
Please find page 58 of the 2010 GNC annual report below. You can navigate through the pages in the report by either clicking on the pages listed below, or by using the keyword search tool below to find specific information within the annual report.-
 1
1 -
2
-
3
-
4
-
5
-
6
-
7
-
8
-
9
-
10
-
11
-
12
-
13
-
14
-
15
-
16
-
17
-
18
-
19
-
20
-
21
-
22
-
23
-
24
-
25
-
26
-
27
-
28
-
29
-
30
-
31
-
32
-
33
-
34
-
35
-
36
-
37
-
38
-
39
-
40
-
41
-
42
-
43
-
44
-
45
-
46
-
47
-
 48
48 -
 49
49 -
 50
50 -
 51
51 -
 52
52 -
 53
53 -
 54
54 -
 55
55 -
 56
56 -
 57
57 -
 58
58 -
 59
59 -
 60
60 -
 61
61 -
 62
62 -
 63
63 -
 64
64 -
 65
65 -
 66
66 -
 67
67 -
 68
68 -
69
-
70
-
71
-
72
-
73
-
74
-
75
-
76
-
77
-
78
-
79
-
80
-
81
-
82
-
83
-
84
-
85
-
86
-
87
-
88
-
89
-
90
-
91
-
92
-
93
-
94
-
95
-
96
-
97
-
98
-
99
-
100
-
101
-
102
-
103
-
104
-
105
-
106
-
107
-
108
-
109
-
110
-
111
-
112
-
113
-
114
-
115
-
116
-
117
-
118
-
119
-
120
-
121
-
122
-
123
-
124
-
125
-
126
-
127
-
128
-
129
-
130
-
131
-
132
-
133
-
134
-
135
-
136
-
137
-
138
-
139
-
140
-
141
-
142
-
143
-
144
-
145
-
146
-
147
-
148
-
149
-
150
-
151
-
152
-
153
-
154
-
155
-
156
-
157
-
158
-
159
-
160
-
161
-
162
-
163
-
164
-
165
-
166
-
167
-
168
-
169
-
170
-
171
-
172
-
173
-
174
-
175
-
176
-
177
-
178
-
179
-
180
-
181
-
182
-
183
-
184
-
185
-
186
-
187
-
188
-
189
-
190
-
191
-
192
-
193
-
194
-
195
-
196
-
197
-
198
-
199
-
200
-
201
-
202
-
203
-
204
-
205
-
206
-
207
-
208
-
209
-
210
-
211
-
212
-
213
-
214
-
215
-
216
-
217
-
218
-
219
-
220
-
221
-
222
-
223
-
224
-
225
-
226
-
227
-
228
-
229
-
230
-
231
-
232
-
233
-
234
-
235
-
236
-
237
-
238
-
239
-
240
 |
 |

Table of Contents
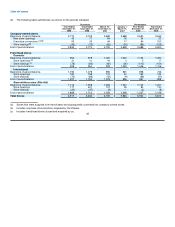
Warehousing and distribution costs. Warehousing and distribution costs increased $14.6 million, or 34.1%, to $57.5 million for the year
ended December 31, 2008 compared to $42.9 million for the 2007 Successor Period. The increase is primarily due to comparing a 366 day
period to a 291 day period. To a lesser extent, the increase was due to increases in shipping and fuel costs, and an increase in wages to
support internet fulfillment. Consolidated warehousing and distribution costs, as a percentage of net revenue, were 3.5% for both the year
ended December 31, 2008 and the 2007 Successor Period.
Occupancy costs. Occupancy costs increased $52.4 million, or 32.3%, to $214.6 million for the year ended December 31, 2008
compared to $162.2 million for the 2007 Successor Period. The increase is primarily due to comparing a 366 day period to a 291 day period.
Additionally, we recognized higher lease related costs, primarily as a result of scheduled increases in our store leases, and the addition of 29
corporate stores since December 31, 2007, and an increase in depreciation expense related to these same additional stores. Consolidated
occupancy costs, as a percentage of net revenue, were 13.0% for the year ended December 31, 2008 compared to 13.3% for the 2007
Successor Period.
Selling, General and Administrative ("SG&A") Expenses
Our consolidated SG&A expenses, including compensation and related benefits, advertising and promotion expense, other selling,
general and administrative expenses, and amortization expense increased $101.5 million, or 33.6%, to $403.6 million for the year ended
December 31, 2008 compared to $302.1 million for the 2007 Successor Period. The increase is primarily due to comparing a 366 day period to
a 291 day period. These expenses, as a percentage of net revenues, were 24.4% for the year ended December 31, 2008 compared to 24.7%
for the 2007 Successor Period.
Compensation and related benefits. Compensation and related benefits increased $54.0 million, or 27.6%, to $249.8 million for the year
ended December 31, 2008 compared to $195.8 million for the 2007 Successor Period. The increase is primarily due to comparing a 366 day
period to a 291 day period. Secondarily, full-time and part-time wages increased to support an increased sales volume and store base.
Compensation and related benefits, as a percentage of net revenues, was 15.1% for the year ended December 31, 2008 compared to 16.0%
for the 2007 Successor Period.
Advertising and promotion. Advertising and promotion expenses increased $20.1 million, or 57.3%, to $55.1 million for the year ended
December 31, 2008 compared to $35.0 million for the 2007 Successor Period. The increase is primarily due to comparing a 366 day period to a
291 day period. Advertising and promotion costs, as a percentage of net revenues, were 3.3% for the year ended December 31, 2008
compared to 2.9% for the 2007 Successor Period. This increase is primarily attributable to an increase in agency fees and media advertising.
Other SG&A. Other SG&A expenses, including amortization expense, increased $27.4 million, or 38.6%, to $98.7 million for the year
ended December 31, 2008 compared to $71.3 million for the 2007 Successor Period. Other SG&A expenses, as a percentage of net revenues
were 6.0% for the year ended December 31, 2008 compared to 5.8% for the 2007 Successor Period. The increase is due to comparing a
366 day period to a 291 day period. Additionally, the increase is attributable to additional third party commission expense on higher commission
sales, higher telecommunications expense due to the installation of a new POS register system, and higher bad debt expense. Other SG&A
expenses, as a percentage of net revenues were 6.0% for the year ended December 31, 2008 compared to 5.8% for the 2007 Successor
Period.
Foreign Currency (Loss) Gain
Foreign currency loss/gain for the year ended December 31, 2008 and the 2007 Successor Period resulted primarily from accounts
payable activity with our Canadian subsidiary. We incurred a loss of $0.7 million for the year ended December 31, 2008 compared to a gain of
$0.4 million for the 2007 Successor Period. 52