GNC 2010 Annual Report Download - page 119
Download and view the complete annual report
Please find page 119 of the 2010 GNC annual report below. You can navigate through the pages in the report by either clicking on the pages listed below, or by using the keyword search tool below to find specific information within the annual report.-
 1
1 -
2
-
3
-
4
-
5
-
6
-
7
-
8
-
9
-
10
-
11
-
12
-
13
-
14
-
15
-
16
-
17
-
18
-
19
-
20
-
21
-
22
-
23
-
24
-
25
-
26
-
27
-
28
-
29
-
30
-
31
-
32
-
33
-
34
-
35
-
36
-
37
-
38
-
39
-
40
-
41
-
42
-
43
-
44
-
45
-
46
-
47
-
48
-
49
-
50
-
51
-
52
-
53
-
54
-
55
-
56
-
57
-
58
-
59
-
60
-
61
-
62
-
63
-
64
-
65
-
66
-
67
-
68
-
69
-
70
-
71
-
72
-
73
-
74
-
75
-
76
-
77
-
78
-
79
-
80
-
81
-
82
-
83
-
84
-
85
-
86
-
87
-
88
-
89
-
90
-
91
-
92
-
93
-
94
-
95
-
96
-
97
-
98
-
99
-
100
-
101
-
102
-
103
-
104
-
105
-
106
-
107
-
108
-
 109
109 -
 110
110 -
 111
111 -
 112
112 -
 113
113 -
 114
114 -
 115
115 -
 116
116 -
 117
117 -
 118
118 -
 119
119 -
 120
120 -
 121
121 -
 122
122 -
 123
123 -
 124
124 -
 125
125 -
 126
126 -
 127
127 -
 128
128 -
 129
129 -
130
-
131
-
132
-
133
-
134
-
135
-
136
-
137
-
138
-
139
-
140
-
141
-
142
-
143
-
144
-
145
-
146
-
147
-
148
-
149
-
150
-
151
-
152
-
153
-
154
-
155
-
156
-
157
-
158
-
159
-
160
-
161
-
162
-
163
-
164
-
165
-
166
-
167
-
168
-
169
-
170
-
171
-
172
-
173
-
174
-
175
-
176
-
177
-
178
-
179
-
180
-
181
-
182
-
183
-
184
-
185
-
186
-
187
-
188
-
189
-
190
-
191
-
192
-
193
-
194
-
195
-
196
-
197
-
198
-
199
-
200
-
201
-
202
-
203
-
204
-
205
-
206
-
207
-
208
-
209
-
210
-
211
-
212
-
213
-
214
-
215
-
216
-
217
-
218
-
219
-
220
-
221
-
222
-
223
-
224
-
225
-
226
-
227
-
228
-
229
-
230
-
231
-
232
-
233
-
234
-
235
-
236
-
237
-
238
-
239
-
240
 |
 |

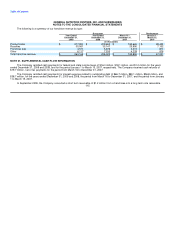
Table of Contents
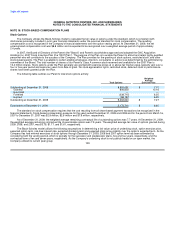
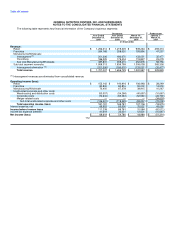
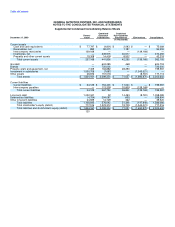
GENERAL NUTRITION CENTERS, INC. AND SUBSIDIARIES
NOTES TO THE CONSOLIDATED FINANCIAL STATEMENTS
Successor Predecessor
Year Ended Year Ended March 16 - January 1 -
December 31, December 31, December 31, March 15,
2009 2008 2007 2007
(in thousands)
Depreciation and amortization:
Retail $ 24,164 $ 21,449 $ 14,806 $ 4,114
Franchise 4,081 5,001 4,025 365
Manufacturing / Wholesale 10,926 9,783 7,014 1,714
Corporate / Other 7,494 6,220 4,156 1,183
Total depreciation and amortization $ 46,665 $ 42,453 $ 30,001 $ 7,376
Capital expenditures:
Retail $ 20,640 $ 33,074 $ 18,347 $ 4,778
Franchise 2 7 4 —
Manufacturing / Wholesale 4,527 11,108 6,694 285
Corporate / Other 3,513 4,477 3,806 630
Total capital expenditures $ 28,682 $ 48,666 $ 28,851 $ 5,693
Total assets
Retail $ 1,262,755 $ 1,263,229 $ 1,242,999 $ 472,131
Franchise 468,949 471,247 476,685 273,348
Manufacturing / Wholesale 423,884 436,018 426,250 129,438
Corporate / Other 149,240 121,514 93,698 106,348
Total assets $ 2,304,828 $ 2,292,008 $ 2,239,632 $ 981,265
Geographic areas
Total revenues:
United States $ 1,618,452 $ 1,567,641 $ 1,156,806 $ 314,804
Foreign 88,555 89,088 66,181 15,025
Total revenues $ 1,707,007 $ 1,656,729 $ 1,222,987 $ 329,829
Long-lived assets:
United States $ 193,762 $ 201,787 $ 189,416 $ 181,617
Foreign 10,151 6,885 6,526 3,323
Total long-lived assets $ 203,913 $ 208,672 $ 195,942 $ 184,940
The following table represents sales by general product category. The category "Other" includes other wellness products sales from the
Company's point of sales system and certain required accounting adjustments of $5.7 million for 2009, $4.7 million for 2008, $5.0 million for the
period from March 16 to December 31, 2007, and ($0.6) million for the period from January 1 to March 15, 2007.
113